Summary
We revamped this trucking operator’s demand forecasting models to optimize fleet placement across North America.

Take Our Content to Go
Background
One of North America’s leading trucking companies created a revenue management program with a strong emphasis on analytics. The program and underlying projects were identified as a key priority. The trucking organization believed they could significantly improve their business through predictive analysis and data science. The trucking company had many different projects going on at once and needed a premier analytics consulting company to provide support over a number of different areas.
The customer decided the best model to support their initiatives was through Mosaic’s Rent a Data Scientist engagement model. This allowed the trucking operator to utilize multiple Mosaic resources at any point to complete specific analytical tasks.One task on their analytics roadmap was identified as the most important and impactful at the beginning of the relationship. The revenue management team believed data science methods could be used to identify time-dependent trends in demand and to characterize demand patterns related to produce harvest seasonality. The trucking operator identified produce harvesting in the southeastern United States as the first market they wanted to analyze.
Through an extensive data mining process, Mosaic saw the regional seasonality, sought out sources of harvest data from state-level departments of agriculture, and realized the impact of watermelons showed the most promise after we had looked at data covering about 20-30 cash and commodity crops. The trucking operator wanted to identify the cause of the demand trends to anticipate upcoming significant changes in demand and adjust resources accordingly. The trend was not isolated to the one trucking operator and affected the entire market every year.
Predictive Trucking Analytics Development
The trucking operator identified trends in daily order volume that occurs in the southeast during the same time period as produce season in that area every year. The revenue management team hypothesized that this increase in orders was due to an increase in demand for trucking to haul loads of fresh produce. Mosaic evaluated the hypothesized trend using data internal and external to the client. The trucking operator’s order volume data included recorded number of orders fulfilled and turned down and information such as the date, origin, and location of those orders. This information was used to assess daily and seasonal time-dependent trends in the data. Mosaic also used data from external sources including data from the US Department of Agriculture (USDA) and state-level agriculture departments for produce harvest and shipping trends and data for market-wide demand in the industry.
This produce season trend in orders was particularly strong in the southeast and was not unique to the client. Figure 1 shows the increase in demand for trucking services in the southeast during the key produce harvest months of March-June from an industry-wide data source.
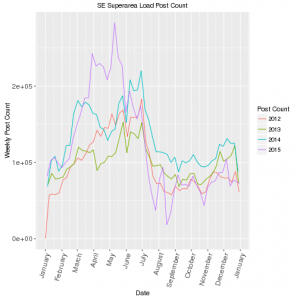
Using market-wide data to evaluate impacts of the produce harvest and other seasonal factors, Mosaic used exploratory analysis techniques and found that produce season-related order trends in Florida and Georgia are consistent with order volume seasonality seen at the trucking company. Mosaic’s analysis found that the watermelon harvest was one of the main produce harvesting activities correlated with the trucking operator’s demand trends.
Transporting harvested produce requires refrigerated trucks, which the trucking operator does not operate. However, it was hypothesized that the produce harvest caused an excess of demand that effected the entire market as growers and distributors looked for drivers and cabs to ship their produce. The trucking operator expected to see an increase in demand in the southeastern region caused by demand displaced by the produce being shipped out of that area. Citrus harvest corresponds with the demand increase, but was predominantly shipped by train, not truck. However, significant capacity was required to haul watermelons, so they had a large impact on the trucking operator’s demand.
Predictive Trucking Analytics Deployment
Mosaic then used predictive analysis to evaluate the time-dependent trends in the demand. This predictive analysis resulted in identifying consistent repeatable trends within the client’s order volume data, as well as a set of variables that could be used to predict these trends in the future. In the effort to confirm the existence and repeatability of the trend, Mosaic developed the predictive model using ARIMAX time series modeling to predict the future trends in the order volume. Other time series models such as ARIMA and time series regression were considered and evaluated. The ARIMAX model offered the best predictive capabilities because it leveraged trend information from the USDA along with produce-level data, and information from historic trends in demand. The ARIMAX model predicts weekly order volume, and the trucking operator will use this model to forecast upcoming trends.
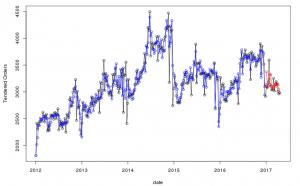
Mosaic developed the model in R, the statistical programming language, and delivered the predictive model as an R script that generates a pdf report with forecasted demand and graphics. The data sources for the model are updated weekly, and the script can be run every week to generate predictions for upcoming weeks. The model forecasts a month into the future, and the forecast horizon can be adjusted based on business needs. Figure 2 is data visualized from the predictive model. The model results over the training and testing windows are shown in blue and red, respectively. The model is trained on pre-2017 data, and a forecast is generated and tested for the first quarter of 2017. Forecast demand was, on average, within +/- 4% of actual during the test period.
Results
The predictive trucking analytics model delivered by Mosaic accurately predicts impacts of seasonal factors and gives the trucking operator better confidence in forecasts.
The ARIMAX model was tested during 2017, and performance metrics were calculated to measure how the model would perform when in use. The model performance was measured by MAPE (Mean Absolute Percent Error). The MAPE was an average of about 4%, indicating that the model would correctly identify trends in the demand with about 4% error in the number of predicted truckloads. This gives the trucking operator the ability to foresee changes in the demand trend a few weeks before the change occurs so they can plan for the predicted changes.
Now that the trucking company is able to foresee future trends, they can better position their fleet of over 10,000 trucks to better meet the demand and maximize revenue per load and subsequent loads.