Summary
Retail inventory optimization is a great candidate use case to apply machine learning & deliver immediate business value.

Take Our Content to Go
Retail Inventory Optimization Problem Definition
A leading outdoor lifestyle retailer needed to find a data science firm who could help design and develop predictive models for their merchandising teams to use in making buying decisions for size profiles in their apparel and footwear lines. Previously, all decisions were made manually based on historical sales data, and the customer data science team believed that automating much of the process, integrating new data sources, and running predictive analysis on these data streams would help the merchandising team make better decisions in a shorter timeframe.
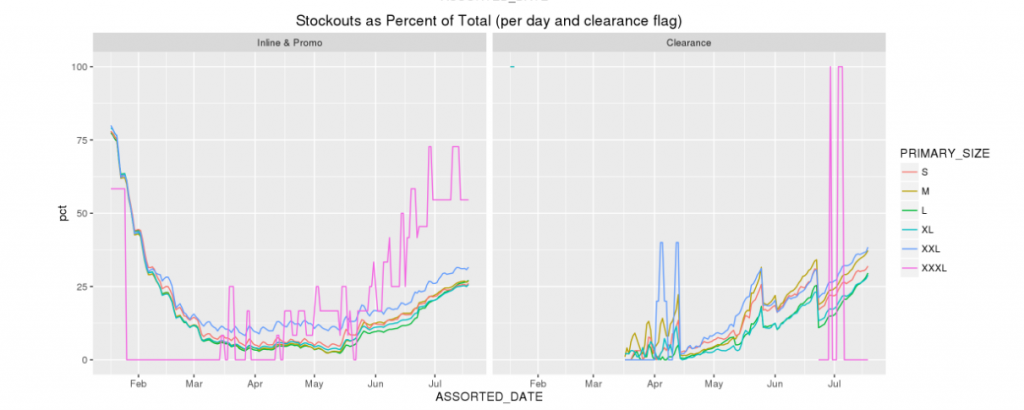
Size profiles establish store-level and national target distributions of sizes (S, M, L, etc.) at the product-color level for apparel items and are used to guide purchase and inventory movement decisions. Improved decision support that accounts for more than simply historical sales improves in-store and warehouse inventory balance, leading to reduced markdowns and stockouts and higher overall revenue-per-unit.
Mosaic Data Science, a premier retail AI consulting firm, was contracted to work iteratively and collaboratively with the customer data science team to assess potential approaches and aggressively implement the one with the biggest impact.
Retail Inventory Optimization | Exploratory Data Analysis
The first phase of the project was exploratory to validate hypotheses and answer questions about the current size profiles, quantify the potential business opportunity in improving the profiles, and develop insights that would guide the modeling activities in Phase 2.
The customer team brought Mosaic an initial list of questions to be answered during the first phase of work that were refined and added to as early insights started flowing:
- What are the factors driving differences in size profiles across products/regions?
- At what level of the product hierarchy do size profiles vary?
- What is the impact of store-level minimum inventory constraints on sales and margin?
- What is the impact of inventory imbalances on sales and margin?
- What is the impact of stockouts on the observed distribution of sales across sizes?
- What is the potential ROI from optimizing size profiles to better account for past inventory imbalances and stockouts?
Retail Inventory Optimization | Predictive ML Model Selection
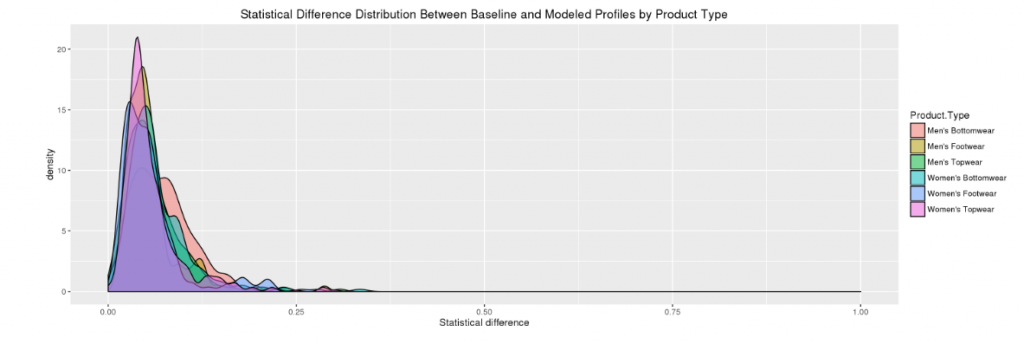
Mosaic’s data science consultants, in collaboration with the customer data science team, determined that an automated tool that generated a recommended size profile for any product within the customer’s catalog would be the best way to implement the predictive model. The tool determines a level of aggregation based on each product’s color, brand, and product category. Based on the store assortment plan for the product, the tool then aggregates historical demand from the appropriate time period across the assorted stores for each size of a product and returns a relative (percentage) size distribution for the style-color. The size distribution is written to a database table that can be read by the various tools in the merchandising toolset.
Mosaic built the predictive retail inventory optimization model in R. The tool takes its input data from tables in the Business Intelligence database and writes its outputs to a table in the same database. The size profiles are refreshed daily to adjust for any changes to the product catalog or store assortment plans.
Mosaic designed the model with three key components
- Impute lost sales: Historical sales are adjusted to estimate lost sales during observed store-level stockouts.
- Product hierarchy aggregation: Products from past seasons are aggregated based on their brand, color, and place in the customer product hierarchy. If an insufficient volume of sales was observed within this group of products then multiple aggregation groups are combined.
- Size profile generation: Each product to be assorted is matched to the appropriate aggregation group. Based on the store assortment plan for the product and the historical observed and lost sales for the product’s aggregation group, a size profile is generated that recommends how an inventory buy for the product should be distributed across sizes.
Retail Inventory Optimization Results
Mosaic brought cutting-edge techniques from machine learning, predictive analytics, and data engineering to help this retailer optimize their merchant buying decisions. The client now better understands their apparel and footwear demand, allowing them to make decisions that decrease stockouts, reduce end-of-season markdowns, and increase revenues at the item level.
The tool Mosaic designed and implemented provides automated recommendations for product-specific order distribution across sizes. This brought the merchandising team from a spreadsheet-based approach with substantial limitations into a world where much more data can be utilized to make better decisions. This saves the merchandising team much needed time and allows them to place the right product at the right store at the right time.