Summary
The business was therefore investigating how to incorporate modern data science techniques into their budgeting decisions. Since they didn’t have this expertise in-house, they needed an analytics partner that could provide the right capabilities to accurately model and forecast revenue and serve these results to users in the proper context. Financial Services Revenue Forecasting is critical to the bottom line.

Take Our Content to Go
Building better forecasts with Machine Learning
For any business, planning is critical to success. Revenue & sales forecasting helps organizations make sound financial decisions and is an essential metric of organizational health. When executive leadership knows what is coming down the pike, they adapt to changing conditions and prioritize your efforts toward building a better business.
Revenue predictions have far-reaching implications because they drive budgeting and resource planning. When these projections are untrustworthy, orgs make inefficient & ineffective investment decisions.
Machine learning, specifically time series algorithms, makes revenue forecasting intelligent, agile, and accurately reflects market dynamics. Most organizations conduct forecasting using a human-intensive, spreadsheet-based approach that requires input and involvement from several departments; this leads to bias & subjectivity bleeding into the data, methodology, and outputs that only is refreshed annually; which doesn’t align with critical decisions that need to be made on different time horizons. It should be noted that to increase adoption; Mosaic will frequently blend modern ML with traditional approaches to increase comfort with the forecasts.
Machine learning automates the prediction process, reducing cycle time and human effort. Algorithms can be trained to ingest demand data, generate performance forecasts, and identify warning signals such as seasonality. A comprehensive forecasting solution doesn’t begin and end with algorithm development; data scientists need to employ production practices such as MLOps, to ensure that the machine learning models remain resilient against changes to the input data, bias creep, and accuracy degradation.
Mosaic believes machine learning needs to be explainable, actionable, and usable. In the following case study, we helped a leading insurance company automate & innovate its revenue forecasting processes.
Financial Services Revenue Forecasting
A sizeable Canadian insurance services company was preparing for their next budgeting cycle and considering new approaches to forecasting their revenue for the coming year. Earlier, they had attempted to take a data-driven approach to revenue forecasting; however, the previous system was now outdated and did not make full use of significant financial metrics. The business was therefore investigating how to incorporate modern data science techniques into their budgeting decisions. Since they didn’t have this expertise in-house, they needed an analytics partner that could provide the right capabilities to accurately model and forecast revenue and serve these results to users in the proper context.
Mosaic, a leading data science consultancy, was engaged to build upon the previous work and modernize it, using machine learning forecasting methods. The objectives of the project were to:
- Create an accurate forecasting model for overall revenue,
- Incorporate new metrics into the model so that predictions could be made based on various what-if scenarios, and
- Develop a simple interface that would allow users to explore model predictions and incorporate model results into their budgeting decisions.
Mosaic quickly developed a project framework in collaboration with the subject matter experts (SMEs) to provide a fast and agile means of iterating on the model and interface. The framework included frequent working sessions and SME reviews of the work accomplished so that feedback could be constantly integrated into development. This would allow the team to pivot based on new findings and evolving user requirements.
A Two-Part Approach
Following the framework, Mosaic data scientists began developing two workstreams in parallel: a modeling workstream to create accurate revenue forecasts and a user-interface workstream to create the interface that would serve revenue forecast results to users and allow them to explore the findings.
Mosaic began its modeling work by developing a list of essential features that could predict revenue in the future. By listening to the SMEs and applying their data analysis expertise, they narrowed it down to a final set of features that could be tested in revenue modeling. These features were iteratively included in various modeling approaches, such as ARIMA and LASSO regression, and the performance of each model was evaluated on holdout test data to determine which feature set, and model provided the best performance. Once the best model was identified, all data were included in the final modeling to estimate revenue forecasts into the future.
In parallel, Mosaic created an Excel-based tool to provide a user interface (UI) for experts to incorporate model predictions into their decisions. Excel was chosen as it is a familiar tool used in finance and budgeting. This would provide an easy-to-use software product that could be easily integrated into existing workflows. This interface included a data table that accommodated new predictions and meta-data from the modeling work. Pivot tables allowed users to select subsets of forecasts based on selection criteria. Then automated plotting functions served those final predictions in relevant plots that provided valuable context for the user.
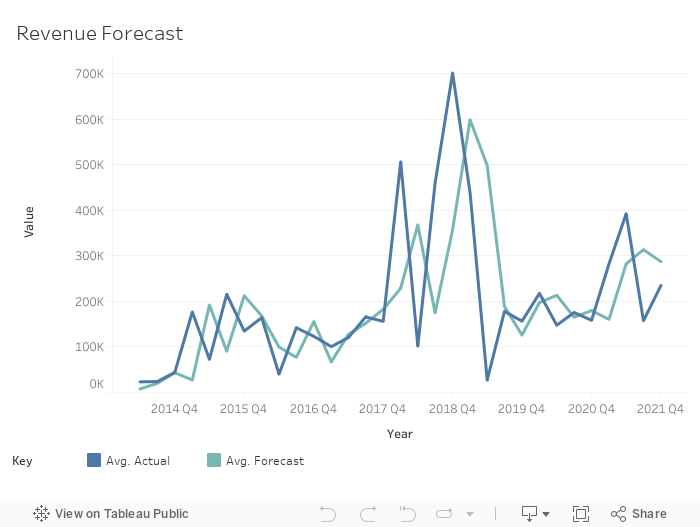
Financial Services Revenue Forecasting Results
Once both workstreams were finalized, the modeling results and final UI were integrated into a deliverable that provided revenue forecasts, in an Excel format, with all the relevant data and charts in one convenient package. Critically, Mosaic’s model performed very strongly, providing mean absolute errors in testing less than 4% on annualized revenue.
These results inspired confidence which encouraged users to include model findings in their decision-making. The Excel interface allowed the model results to be quickly disseminated to key players within the business. It enabled discussion about how best to leverage the findings in their final budgeting decisions. Overall, this project demonstrated new ways of thinking about budgeting and incorporating modern data science technologies, alongside familiar tools like Excel, into financial planning tasks.