Summary
Optimizing seasonal staffing and resourcing is a key challenge for many industries, especially when the exact timing of high-volume activity can change based on complex factors.

Take Our Content to Go
Every Business Has a Workforce
Optimizing seasonal staffing and resourcing is a key challenge for many industries, especially when the exact timing of high-volume activity can change based on complex factors. Augmenting the workforce too early means diverting profit to unnecessary personnel costs, while waiting until high-volume demand is already underway risks operating below capacity and decreasing customer satisfaction (e.g., if there are long wait times).
Predictive analytics can be deployed to forecast seasonal demand, helping firms to anticipate periods with increased staffing needs. Whether daily, weekly, or monthly forecasting is required, advanced analytics and machine learning can drive operational efficiency through better resource allocation.
Mosaic Data Science has deep expertise in using data to increase ROI through efficient workforce planning. This paper describes recent workforce planning prediction project approaches in which Mosaic’s data science and machine learning consultants used demand forecasting to predict staffing needs in energy and health care verticals.
Energy Use Case: Forecasting Demand for Heating Reactivation Technicians
Many power generation and transmission companies face the challenge of determining what staffing levels they need to meet their customers’ winter heating demand. This is especially important for utilities operating in colder climates. While customers pay less attention to their heating service in the warmer months, when the cold hits, heating becomes critical and service requests begin to pile up. This can leave many companies caught off-guard, without the staffing and other resources ready to meet customers’ needs.
A utility operator in a chilly climate came to Mosaic with a request to build a model that predicts when customers will reactivate or service their heating systems. Reactivation and service events involve technicians visiting residential homes, putting a significant drain on dispatch resources and workload planning. events generally correlate with weather, but there is still quite a bit of variability that makes it hard to pinpoint based on weather alone. Other factors contribute to this timing, in perhaps non-linear ways, and machine learning is an effective way to map these complex relationships.
The utility had been collecting historic service requests but wanted to fuse these data with other sources to provide a better prediction to the schedulers responsible for planning staffing levels, so that they could work to improve response times to customer requests and operational efficiency.
Mosaic investigated many relevant data sources and ultimately developed a machine learning model that pulls data from weather, energy usage, historic heating requests, and other sources to support or disprove hypotheses, identify patterns/clusters in the data, and define workload planning for the winter season. Once Mosaic and the business worked together to determine that the model was accurately predicting heating reactivation requests, Mosaic was tasked with integrating this predictive model into the existing business workload planning system.
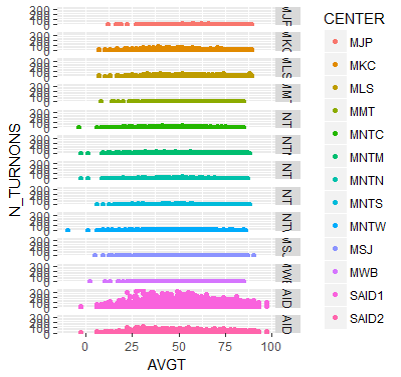
The utility was particularly interested in identifying the factors that influence heating reactivation request volumes and quantifying the underlying seasonal patterns driving macro-level changes over time. To address these questions, Mosaic data scientists first used data visualization techniques (e.g., Figure 1) to get a sense of relationships between dependent and independent variables to draw out seemingly obvious hypotheses, and to uncover hidden relationships in the data. For example, Figure 1, which shows the temperature in degrees Fahrenheit along the x-axis, and the number of reactivation requests in a particular region on the y-axis, clearly shows that temperature has a location-specific effect on reactivation. The two distributions towards the bottom of the figure show larger numbers of turn-on requests at lower temperatures. In contrast, some of the other locations show constant request rates across a range of temperatures, suggesting a more consistent demand.
After completing the initial EDA phase, Mosaic tested a number of different algorithmic approaches to predict heat reactivation requests within different time horizons (intervals of between 2 and 30 days) and in 13 geographic regions. Separate models were created to predict requests for each time horizon and region.
The model training and selection process involved fitting and evaluating many combinations of features and hyperparameters, multiple times, each in a cross-validation process. In an effort to find the highest-performing model among these combinations, the data science consulting team automated the workflow including hyperparameter tuning, model training and saving, and reporting in order to reduce the manual workload.
The machine learning algorithms investigated included linear regression, random forest, single layer neural network, and XGBoost. While each learner showed promise, XGBoost tended to outperform in accuracy, as shown in Figure 2, and was ultimately selected as the model to use in production.
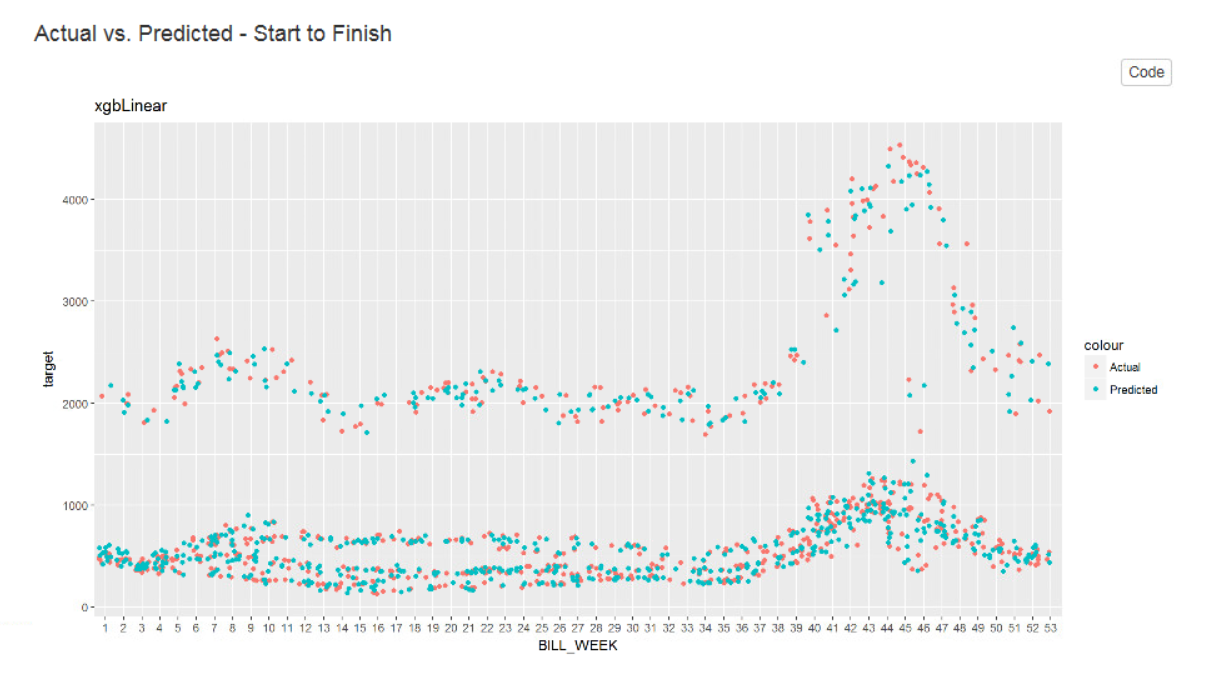
Figure 2. Plot showing predicted vs. actual reactivation events by week. Each red dot on the plot shows the actual number of requests received in a single week for a specific geographic region, and each blue dot shows the number of requests predicted by the machine learning model for that week
Mosaic’s workforce planning prediction machine learning model allows the utility to proactively plan for heat reactivation events well before a spike in demand, allowing the company to manage its workforce to meet customer expectations and keep houses warm in the winter.
Health Care Use Case: Predicting Emergency Room Staffing Needs
A leading not-for-profit children’s hospital system had seen an increase in the last two years in the number and duration of children’s Intensive Care Unit (ICU) saturation events. A saturation event occurs when the bed capacity and/or staffing levels in the ICU are not sufficient to cover patient volumes. During these events, patient levels must be controlled by, for example, raising thresholds for ICU admission or redirecting incoming Emergency Department (ED) patients to other hospitals in the network that may not be as well-equipped to provide best possible treatment. These reactive workarounds are not ideal for the patient or hospital. With more foresight, however, the hospital can proactively adjust staffing levels or postpone less urgent scheduled surgeries, which involve ICU recovery time, in order to open up more ICU capacity and avoid a saturation event.
There are known seasonal patterns in ED admissions rates for different conditions. For example, admissions due to heart failure are most common in the winter, whereas admissions for several types of emergency general surgery are most frequent in the summer1,2. Because of the seasonality of demand, the hospital system believed that advanced analytics on past ED visit rates could be used to predict future specialty-specific demand and overall ICU saturation events. If successful, the models could help deploy an appropriate clinical workforce at the right times to best serve critical ICU and ED patients while minimizing expensive overtime staffing and clinician burn-out.
To predict staffing requirements, Mosaic’s data science consultants needed to both accurately predict ED visits and quantify resulting ICU patient volumes. The healthcare provider had 4 years of historical data on patient volumes, staffing schedules, and known saturation events available that could serve as a training dataset for a predictive model. The model would need to predict the weekly inflow of ED patients and the corresponding expected ICU admission rates out to a 12-week time horizon. Mosaic tested 3 different time series forecasting techniques: ARIMA, seasonal exponential smoothing (Holt-Winters), and time series regression. Over 25 different model formulations were tested during the model training phase. Evaluation metrics included mean absolute error (MAE) and mean absolute percent error (MAPE) at different time horizons. These were calculated by running out-of-sample validation data through the time series models to test model accuracy at predicting future ED visits based on historical data. Figure 3 shows the error between actual vs. predicted ED visits.

An ensemble model was applied to help smooth out variability in errors by combining results from the 3 independent models. This forecasting exercise confirmed an insight: seasonality, or time of year, had a very large impact on ED visits. With this knowledge, the organization can dig deeper into the data to determine which months are busiest and begin to implement strategies to reduce saturation events during the busiest times. After Mosaic constructed and validated these time series forecasts, the hospital system wanted to determine what factors had the most significant impacts on ED visits. Mosaic segmented forecasts by 2 hospital locations, patient diagnosis groups (e.g., asthma, vomiting, bronchiolitis), patient acuity at admission, and day and time of patient arrival. The same ensembling method used for the overall forecasts proved quite effective at generating sub-forecasts for each patient segment. The resulting subforecasts allowed the healthcare provider to understand which patient groups were driving the greatest variability in ED arrival rates and how much of this variability within each segment could be accurately forecast.
Mosaic Data Science designed and developed forecasting approaches that produced accurate (within 10% of actual patient volume) ED patient inflow forecasts up to 12 weeks in advance. As a result, the hospital system is able to better allocate staffing and facility resources to make sure the highest quality care is provided to all patients. Applying predictive analytics to patient volumes has the potential to not only increase hospital efficiency, but also improve patient outcomes and save lives.
Predictive Workforce Deployment is Achievable
These types of approaches and machine learning models can easily be tuned to fit use cases in other industries, and in fact, Mosaic has replicated this approach for other organizations. By partnering with our clients and iteratively running analytics workflows, Mosaic is able to drive value by generating customized predictions and optimizations for a workforce planning prediction.
Mosaic Data Science’s analytics consultants have tackled workforce analytics in multiple industries, synthesizing technical knowledge across domains. In one use case for the energy sector, this involved predictive staffing models to optimize the supply of heating service technicians to turn on customers’ heating service as temperatures cooled. In another example for the health care domain, Mosaic developed models to forecast inpatient volumes and enable hospitals to optimize clinical staff planning in preparation for periods of increased demand. In these engagements and others, Mosaic’s machine learning consultants expertly developed and deployed custom predictive demand forecasting models to facilitate more efficient workforce allocation.
Looking to optimize your workforce planning prediction? Let Mosaic apply machine learning and predictive analytics for you!
Looking to develop a workforce planning prediction app? We’ve got you.
- Gotsman, I., Zwas, D., Admon, D., Lotan, C., & Keren, A. (2010). Seasonal variation in hospital admission in patients with heart failure and its effect on prognosis. Cardiology, 117(4), 268-274.
- Zangbar, B., Rhee, P., Pandit, V., Hsu, C. H., Khalil, M., Okeefe, T., … & Joseph, B. (2016). Seasonal variation in emergency general surgery. Annals of surgery, 263(1), 76-81.


0 Comments