Summary
Achieve repair scheduling optimization by integrating third-party weather data and grid asset prioritization into the decision process enables more relevant routing objectives when developing inspection and repair schedules.

Take Our Content to Go
Introduction
Effectively scheduling utility crews to inspect and repair grid assets is critical to ensuring grid health and minimizing outages for customers. While many scheduling software tools can leverage optimization techniques to determine optimal repair schedules, the route optimization components often focus on standard routing objectives, such as minimizing the total number of miles driven or the total expected drive time. However, they don’t consider more utility-specific objectives, weighing other considerations such as weather or asset prioritization. In other words, out-of-the-box algorithms often fail to capture the nuance of the particular problem that needs to be solved.
This white paper explores how we can integrate third-party weather data and utility-specific asset prioritization requirements to build more relevant optimization tools for scheduling the inspection and potential repair of grid anomalies.
This white paper will walk through an example of how optimization techniques can create more intelligent inspection and repair schedules for utilities looking to maintain grid health proactively. While these same techniques can be equally applied to addressing reported outages, the example we will use focuses on scheduling a crew to inspect and potentially repair identified anomalies. In other words, we are scheduling the crew to address potential problems before they come up. We won’t go into the grid anomaly detection details with this white paper, but more information can be found here.1
Anomaly Example
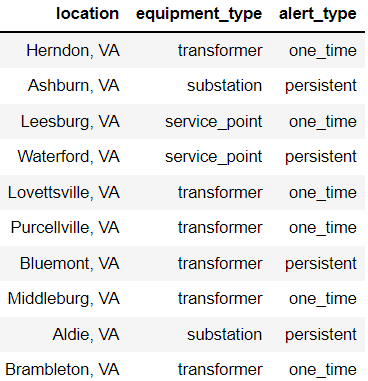
First, we begin with a hypothetical example of ten anomalies that have been detected for an electric utility. For each location, an equipment type (service point, transformer, or substation) is identified, along with whether the detected anomaly was a one-time occurrence or if it has appeared persistently over time. For this example, we use the names of towns in Virginia as our locations to make the problem easier to describe. In practice, anomalies would typically be identified using their coordinates.
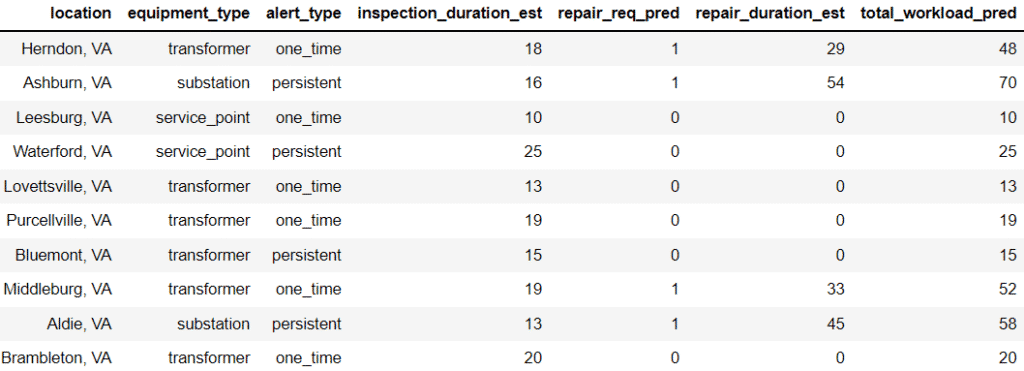
Next, we will predict how long each inspection is expected to take, whether or not a repair will be required, and how long the repair is expected to take. From this, we can determine a total workload prediction for each stop. For purposes of this white paper, we simplify this step to sample these estimates from random distributions. However, these are all unique machine learning problems that Mosaic is well equipped to solve.
Typical Solution
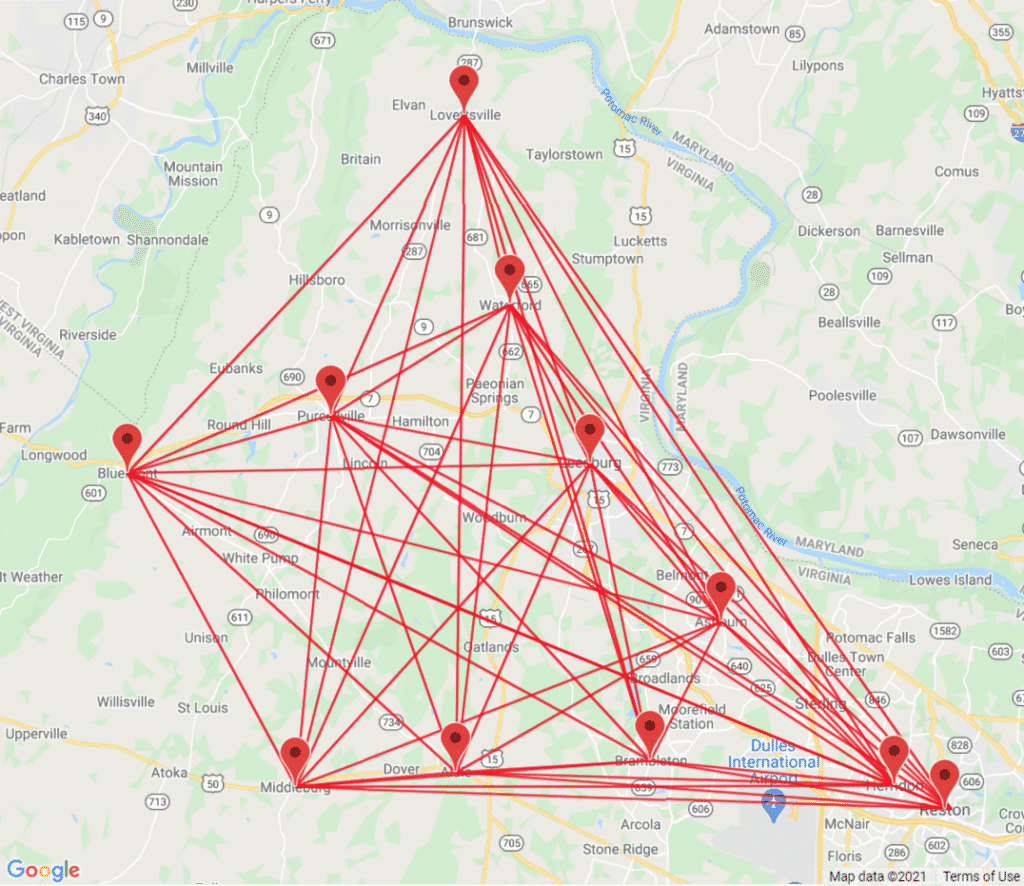
Now a route needs to be decided, determining the best ordering of stops to make, starting from and returning to the initial starting point (Reston, VA in the lower right-hand corner). A visual of all the possible routes between detected anomalies are depicted below.
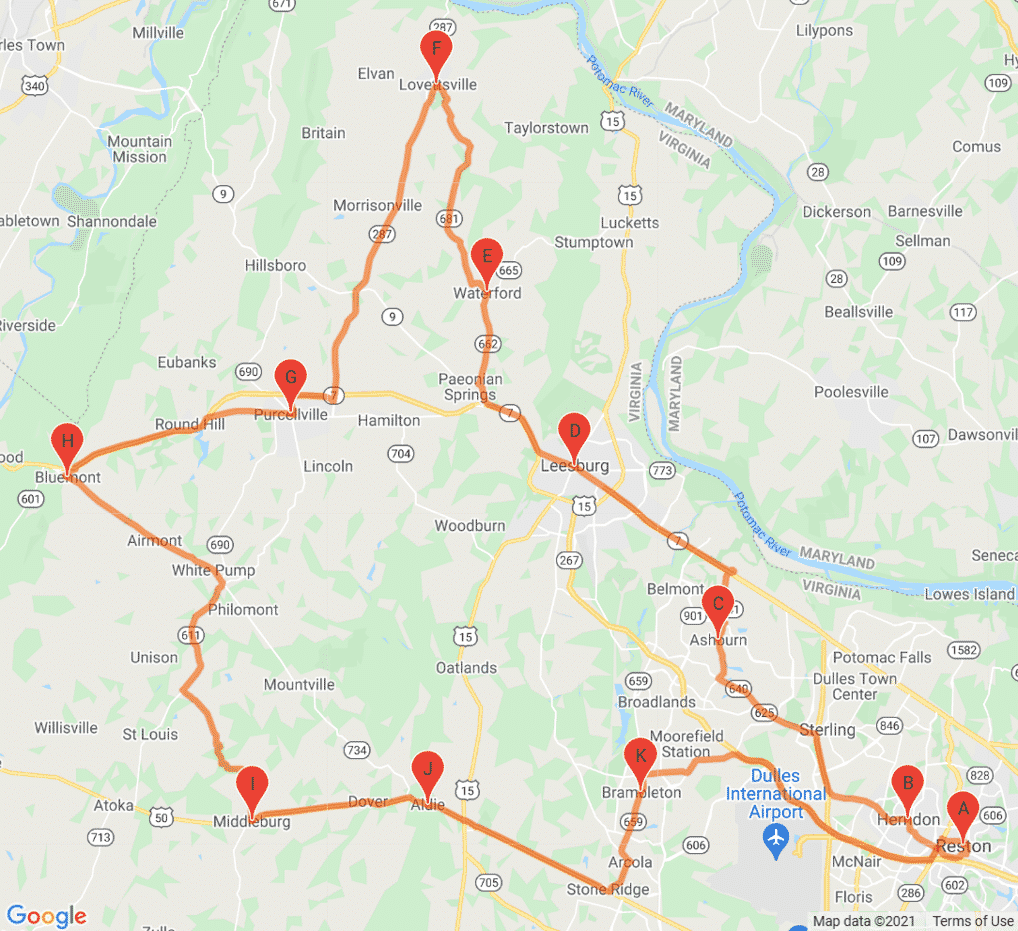
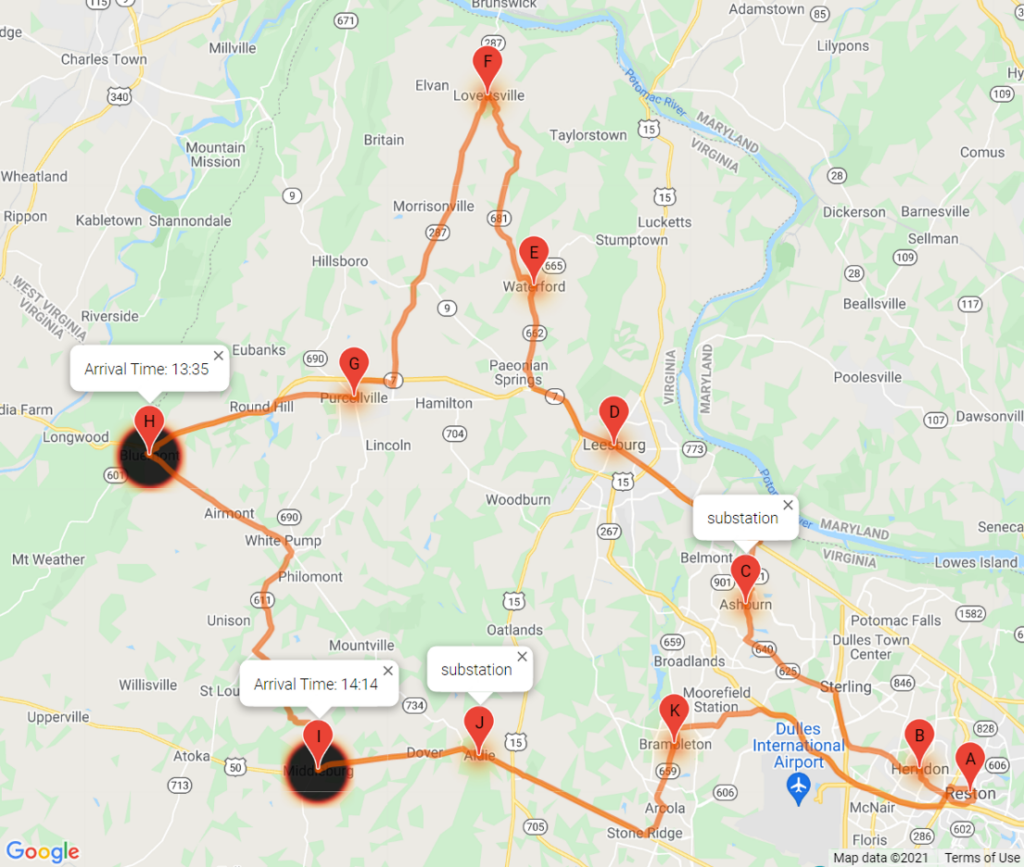
An optimal route for the day is given below. We begin in Reston and head northwest, looping around the stops in a counterclockwise fashion. The objective here is to minimize the total drive time, starting from and returning to point A, while ensuring each intermediate stop is visited along the way. This is a standard route optimization problem, and the solution is what you would likely see if you plugged each stop into a GPS.
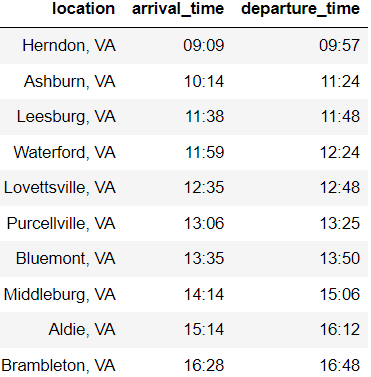
With the recommended route and the total workload predictions, a schedule for the day can be generated. The table below outlines the expected arrival and departure times for each location, accounting for the time spent driving to each site and the time the crew is scheduled to be performing inspections and repairs while at each location.
The Problem
Most field service scheduling applications would probably stop here, as that is the most efficient schedule to complete the work for the day. However, so far, we have ignored a couple of key considerations that the dispatcher would probably want to account for when building a schedule.
- Weather is a crucial consideration for utility work. If a thunderstorm is expected to roll in while the crew is performing a repair, the team will be delayed in their work. Additionally, if a storm rolls through before the staff can inspect the anomaly, it increases the risk of becoming more of a problem. Determining a route that avoids thunderstorms and scheduling the crew to arrive beforehand would be a valuable objective to consider when optimizing the path.
- Not all stops are equally as essential to get to first. An anomaly at a single service point affects one customer, while an anomaly at a substation can affect thousands. Prioritizing stops by the potential number of affected customers would also be a valuable objective to consider.
These objectives are not natively available in a standard GPS. While you can “avoid tolls,” there is no option to “avoid thunderstorms.” Additionally, without fully integrated with the utility, a GPS has no idea that addressing a substation anomaly is more critical than addressing one detected at a service point. To add these objectives, we need to create another optimization layer that can integrate with additional data sources and consider the more unique goals of the utility.
Let us first pull in the weather forecast. Below is an example output from an open-source weather API, which gives us the forecast for each location at each hour.
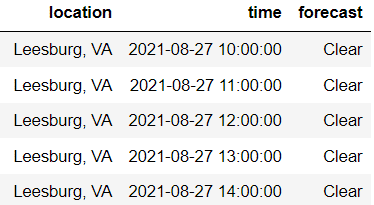
Now, we layer the forecast onto the original route recommendation and observe that a thunderstorm is expected to roll through Bluemont and Middleburg at (or before) the time the crew is expected to arrive. Additionally, we show the locations of the two substations that need to be inspected. We see that the team is not expected to arrive at the Aldie substation until later in the day (stop J). At this point, our current route isn’t looking so optimal anymore.
Improved Solution
From here, we implement a tabu search2 procedure, a meta-heuristic designed to approximate an optimal solution to the new routing problem, and incorporate our additional objectives:
- Minimize the number of thunderstorms forecasted upon or before the scheduled arrival at all stops.
- Prioritize stops by type of anomalous assets, with substations being the highest priority, then transformers, and finally service points.
- And keep the original objective: Minimize the total expected drive time (accounting for traffic).
We also weigh these objectives to enable specific objectives to be prioritized over others. For our example, we apply an equal weighting of 1/3 to each objective. After running the tabu search, we get a new route recommendation:
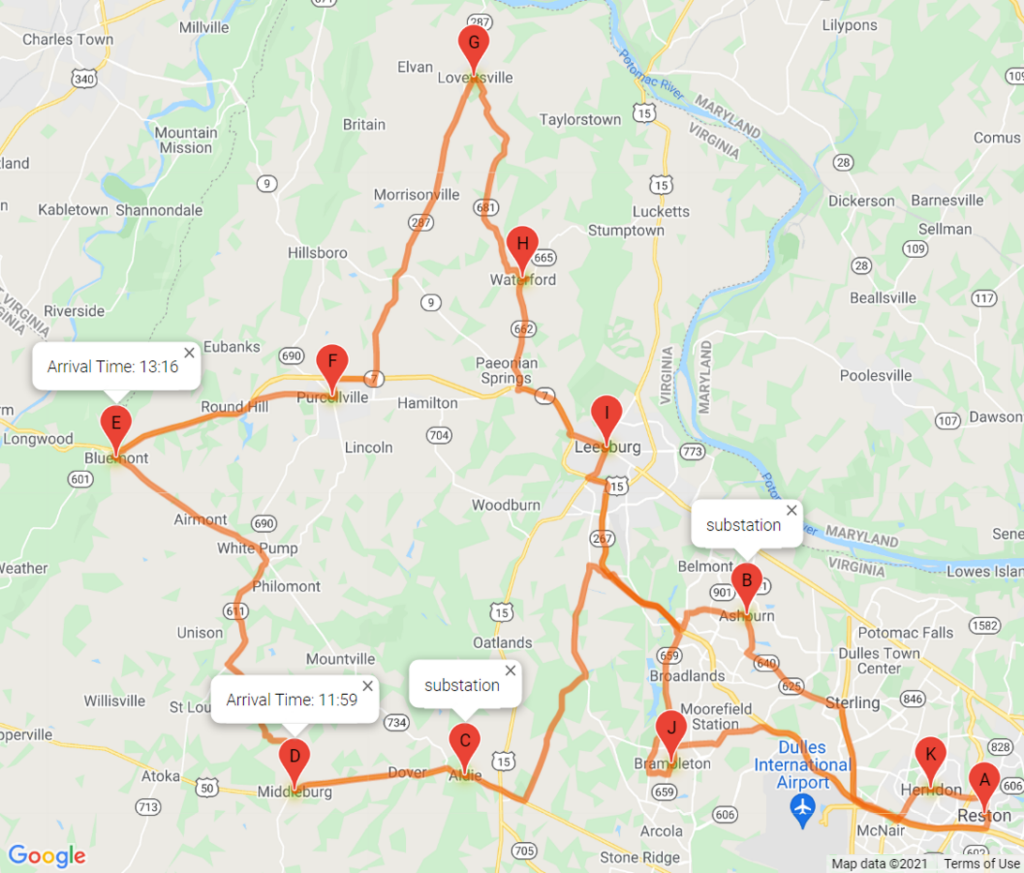
Again, we begin in Reston but skip Herndon to head to the substation in Ashburn directly. Then instead of heading northwest, we go to the substation in Aldie and make stops in Middleburg and Bluemont, arriving before the thunderstorm is expected to roll through. We then continue moving clockwise, making our way back towards Reston before the end of the day.
Repair Scheduling Optimization
In this white paper, we demonstrated the value of thinking more holistically about a problem faced by utilities. We showed where out-of-the-box algorithms fall short and why a custom-built algorithm can help address the nuance of the particular issue at hand. We also demonstrated the power of integrating external data into our solution. Incorporating weather data can be beneficial for utilities, and it is an area where Mosaic has deep experience.
This solution can help dispatchers make better decisions about how to schedule inspections and repairs to more effectively ensure grid health and prevent outages for customers. Our example was simplified only to show one dispatch point and assumed one crew could inspect and repair all anomalies without returning to the dispatch point until the end of the day. However, this solution can readily be expanded to include multiple dispatch points with numerous crews.
If you are a utility looking for a solution to your unique scheduling problem, we would love to get in touch! Feel free to visit the contact us3 page on our website to schedule an introductory call.
Sources
- https://mosaicdatascience.com/2021/03/18/detecting-voltage-anomalies/
- https://mathworld.wolfram.com/TabuSearch.html
- https://mosaicdatascience.com/contact-us/
- Real-time traffic data and standard route optimization was performed using the Google Maps Directions API (https://developers.google.com/maps/documentation/directions/overview)
- Hourly weather forecast data was acquired using the OpenWeather API (https://openweathermap.org/api)


