Summary
Mosaic developed a data-driven alerting solution powered by unsupervised learning to assist a leading energy utility in detecting voltage anomalies & informing optimal grid health decisions.

Take Our Content to Go
Introduction
Our customer is a public utility in North America, serving approximately millions of customers. Like any energy company, they work to keep their electricity grid running optimally while meeting sustainability and customer satisfaction objectives. They wanted to leverage data generated by their smart meters to identify voltage anomalies occurring in their network to efficiently route the correct resources to address these problems. The company had collected quite a bit of sensor information but required a data science partner to turn this raw data into actionable information that their distribution engineering team could consume and respond to in real time.
Need for a Data Science Partner
The energy utility needed the assistance of an experienced data science partner to provide analytics and machine learning insights on the health of the electric grid. Mosaic was tapped to contribute to the project based on our deep experience applying advanced analytics tools to critical operational and strategic decisions for a variety of utility customers.
Voltage Health
The energy company wanted to identify voltage anomalies to inform proactive decision-making regarding where to investigate for potential maintenance issues and where to proactively improve grid assets. If they could identify voltage sags, overloaded or incorrectly tapped transformers, failing voltage regulation components, and malfunctioning meters and fix problems earlier, the company would save money due to more efficient maintenance operations by reducing truck rolls. They also would benefit from greater reliability and increased customer satisfaction. The energy firm believed they had captured sufficient historical data on circuit voltages to build an alert system aided by machine learning that could identify the location of an anomaly and assist in diagnosing its cause.
In collaboration with our utility customer, Mosaic laid out an analytics plan to help identify and categorize anomalies so that they could deploy the right resources to solve the underlying problems. The project team included program managers for both first as well as data engineers, data scientists, and IT engineers. The final deliverable was a custom visualization & alerting tool to support this initiative that leveraged the customer’s GIS and visualization tool to provide a custom dashboard with drilldown to detail reports.
Exploratory Data Analysis (EDA)
Mosaic’s data scientists performed extensive exploratory data analysis to discover different data attributes and validate that the data supported the use case. Mosaic explored trends, correlations, distributions, and other features around how anomalies were mapped and coded by engineers. They analyzed time series data, high/low voltage readings, and correlations of voltage anomalies across transformers and feeder circuits. In other words, the data scientists needed to find a signal in all the noise to identify voltage anomalies that mattered to the utility and best guide their resolution.
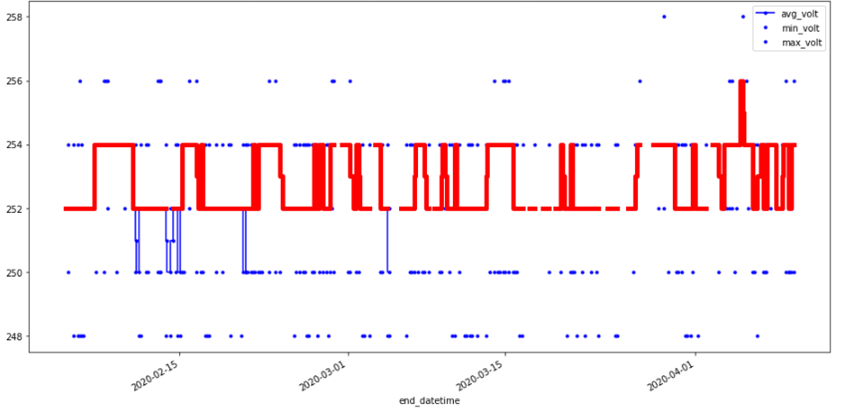
For example, as shown in the EDA screenshot below, Mosaic identified a voltage anomaly and correlated it with a deteriorating transformer. This is an example of an anomaly that matters to the utility because it is actionable – they can assess the transformer and work to repair or replace it.
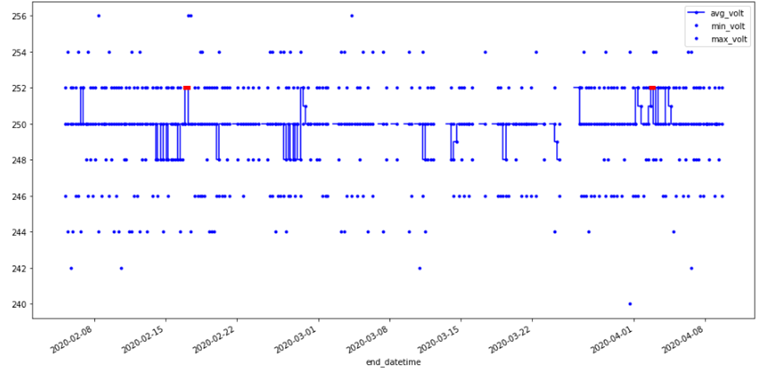
In the following example, the occasional anomalous voltage behavior occurred because of proximity to a nearby generator. This anomaly is an example of “noise” – it does not need to be flagged in the alerting tool.
Instances of average voltage exceeding nominal voltage and maximum value over a set threshold
Unsupervised Machine Learning Development
Mosaic developed a custom unsupervised clustering algorithm to analyze voltage anomalies by type, frequency, and level to see if they were related. We selected this machine learning technique because it looks for previously undetected patterns in a data set with no pre-existing labels to signify a problem and does so with minimal human supervision. The ML model displays the output on a map to aid the engineering team in assessment and diagnosis of their distribution system.
Getting Insights into Decision Makers Hands
Alerting distribution engineers of the anomaly and cause was critical to the success and adoption of this tool. Mosaic identified four basic alert types, denoting low or high voltage and the degree or duration of the anomalous voltage values reported by the meters.
- High Average Voltage – the average measured voltage needs to be above a defined threshold tolerance for at least 24 hours.
- High Maximum Voltage – the maximum measured voltage needs to be above a defined threshold tolerance.
- Low Average Voltage – the average measured voltage needs to be below a defined threshold tolerance for at least 24 hours.
- Low Minimum Voltage – the minimum measured voltage needs to be below a defined threshold tolerance.
What happens when multiple events show simultaneous alerts in the same region? As part of the solution design, Mosaic’s data scientists incorporated feedback from the utility’s distribution engineers on which voltage events were most detrimental to the overall grid. This led to an alert hierarchy where lower-level but related alerts were rolled up to a higher level in order to focus the engineers’ efforts. The hierarchy (in order of severity/importance) was:
- Substation
- Feeder
- Transformer
- Service Point (individual meter)
We also used this understanding to integrate a severity scoring mechanism into the model. The alert types and levels are color coded so engineering teams can easily see and prioritize the workload. For example – as seen in prototype dashboard map below – a feeder alert is ranked higher than a transformer alert because multiple transformers encompass a feeder circuit. Recurring, persistent alerts are also given a higher severity score than one-off occurrences. Mosaic’s collaborative approach enabled this level of customization of the solution and output that would not have been possible without effective communication with the customer.
Data Science Informing Operational Decision Making
Starting with raw voltage readings and ending with a custom alerting system powered by unsupervised learning takes substantial operational knowledge & analytics know-how. Working together, we developed a powerful solution that empowers the utility to monitor their grid in real time, route appropriate resources to the correct locations, identify components that may need to be replaced or repaired, and keep their customers powered up. Through effective collaboration with our clients, Mosaic delivers ML tools that drive automation, transformation, and innovation, saving clients time and money across diverse industries.