Summary
Mosaic helped a leading pharmaceutical company combat clinical trial completion delays and a lack of trust in recruitment forecasts with explainable ML.

Take Our Content to Go
Introduction
With advancements in machine learning & artificial intelligence, it can be challenging for firms to keep up with how to use these new tools & techniques optimally. Legacy problem sets & software are likely candidates for ML-driven improvements, but the integration of these new solutions requires heavy collaboration with industry experts to ensure a solution that actually solves the problem. The line between data science innovation & practical solutioning requires the expertise of an experienced data science consulting firm.
In the following success story, a leading global pharmaceutical firm was frustrated with the lack of accuracy in their trial recruitment system and contracted Mosaic to build a custom, machine learning tool. After struggling with expensive clinical trial completion delays and a lack of trust in recruitment forecasts from an off-the-shelf tool that inhibited a more quantitative approach to trial planning.
As a result, Mosaic designed and executed an innovative, collaborative machine learning plan to help the global pharma company modernize its outdated analytics system, while building intelligent interactive dashboards to facilitate trial manager adoption. The custom model & ML application improved the company’s poor therapeutic trial results, outperforming pharma industry benchmarks by delivering 33% more accurate forecasts.
Clinical Trial Recruitment | An Opportunity for Data Science
The only way to get new medicines to market is to run them through a clinical trial. After a potentially lengthy and expensive drug development period and rising clinical trial costs, it is no surprise that pharmaceutical firms invest substantially in designing the perfect trial. Even so, close to 80% of trials face completion delays. According to Pharmafile, the financial impact of clinical trial delays can be substantial: losses of $0.6M–$8M per day in subsequent sales can be attributed to these delays. While there are various causes of clinical trial delays, Intralinks found that delayed patient recruitment & enrollment caused study delays in 41% of trial sites, making it the second-leading cause of such delays.
For many pharmaceutical firms, trial recruitment forecasting plays a role in trial recruitment planning. However, these forecasts may be generated with relatively simplistic approaches based on only a small subset of available internal & external data. Their poor performance decreases trust in them among trial planners, who, in the absence of dependable forecasts, often need to catch up to the natural tendency to set relatively optimistic trial plans. Trial completion delays and corresponding financial losses and damaged relationships ensue. In the rare cases where trial recruitment plans are set too conservatively, resources and budget are over-allocated to the trial.
Reliable recruitment forecasts can enable more realistic recruitment expectations, leading to improvements in decisions related to clinical trials, such as the selection of a baseline trial recruitment plan, how many and which sites and investigators to select for a trial, and when and how to intervene to improve recruitment during a trial.
Moving Quickly
At the beginning of the project, Mosaic, a top predictive pharma analytics consultancy, collaborated with stakeholders to determine success criteria, assess internal & external data sources, and investigate potential modeling and forecasting solutions. Stakeholders identified three main uses for improved clinical trial recruitment forecasts and a wide range of possible data sources. A review of relevant literature revealed a range of possible modeling approaches. Rather than embarking on a prolonged data engineering effort, extensive research into modeling approaches, and building a solution to serve multiple use-cases, Mosaic and the stakeholders chose to shorten time-to-value and increase early learnings by starting with the most promising and readily available internal & external data and a relatively straightforward predictive modeling approach that adjusted for the most glaring deficiencies in the current off-the-shelf forecasting approach, as well as focusing on just one use-case for the forecasts. After less than 6 months of part-time work by a small team, Mosaic and the company demonstrated enough promise to justify additional investment in deployment of the new approach in a prototype dashboard.
Exploratory Data Analysis | First Step to Predictive Model Development
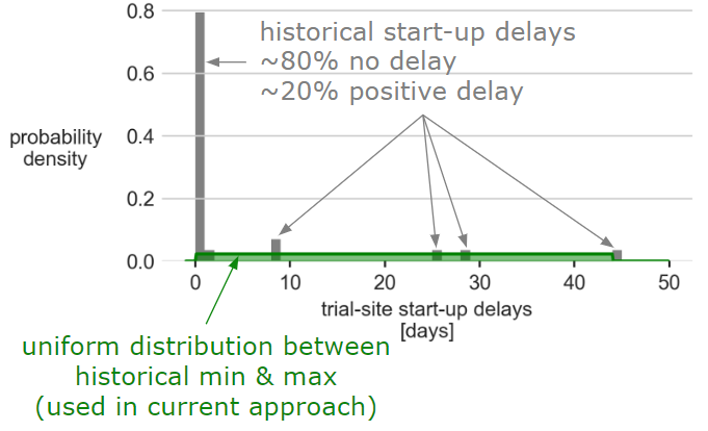
Mosaic follows the CRISP-DM process for most analytics project. An exploratory data analysis (EDA) is critical to understanding the data, evaluating potential new sources, and getting data ready for predictive modeling. After spending time with stakeholders, Mosaic’s data scientists looked for anomalies, identified trends, visualized the data, and began feature engineering to get the data ready for a predictive model. Some EDA results were no surprise, such as the fact that trials rated as more complex were more likely to experience startup delays. Others were unexpected, such as a demonstration via hierarchical regression analysis that variations in recruitment performance depended more on differences in trials than in sites or investigators. The off-the-shelf forecasting tool only used site data when building forecasts, suggesting an opportunity for improvement. Another such predictive pharma analytics opportunity revealed itself during EDA when the distribution of startup delays was found to differ substantially from the distribution assumed by default in the off-the-shelf tool, as shown in the figure below.
Improving Accuracy of Trial Recruitment Forecasts
After reviewing relevant literature and the approach used by the off-the-shelf tool, Mosaic selected Generalized Linear Model (GLM) predictive models of recruitment forecast parameters as the core of the forecasting approach. GLMs are a powerful, flexible, and interpretable approach that predict a full probability distribution of the target or outcome variable conditioned on the input feature values. Predicting distributions was essential in this context because multiple predicted forecast parameter distributions are combined to produce forecasted recruitment distributions. These could be used to produce prediction intervals or predicted probabilities of various outcomes. Producing forecasted distributions, though more challenging than producing point forecasts, was essential to the company’s trial decision-making processes, which consider the chances of various outcomes.
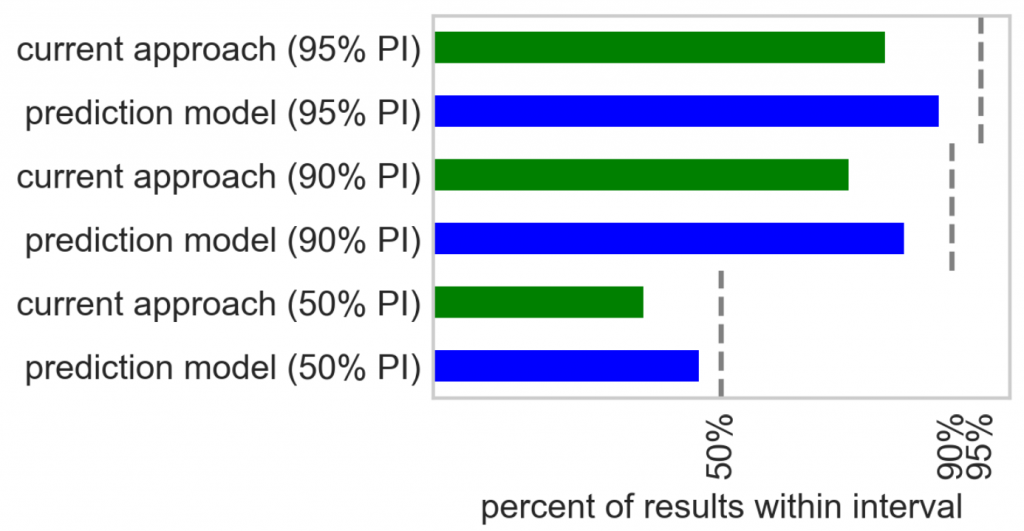
In order to evaluate the performance of the new forecasts relative to the current approach, Mosaic reverse-engineered the off-the-shelf solution and implemented an approximation of it. Forecasting approaches were compared to the actual recruitment at sites and in trials in the test data set. The new forecasting approach produced errors in the count of patients screened at trial-sites that were 33% lower than the current approach. Furthermore, the predictive pharma analytics approach demonstrated superior prediction interval calibration, as shown in the figure below.
Site Selection and Optimization
While more accurate and better calibrated forecasts of the number of patients that a site will recruit in an upcoming trial are useful in their own right for site monitoring and other activities, important trial planning decisions regarding the planned duration of the trial or the goal number of patients to recruit require trial-level forecasts, and each trial involves many sites. Mosaic developed trial-level forecasts while simultaneously proposing sites for the trial, thereby also accelerating another trial planning activity: the selection of sites for the trial. Proposing sites for a trial is a prescriptive analytics optimization problem that Mosaic solved by building upon the site-level forecasts developed earlier. Mosaic worked with the client to specify two variations of the site selection problem. Both approaches depend critically on the predicted distributions of the number of patients recruited at each site over time produced by the site-level forecasting approach.
The first variation of the problem allowed the user to specify the number of sites, how long the recruitment period would last, and how many patients need to be recruited by all the sites in the trial. The optimization approach then finds the set of sites that maximize the probability of achieving the goal number of patients for the trial by the end of the recruitment period. For example, a trial manager could input that they need to recruit 200 patients in 15 weeks with 20 sites, and the tool would select the optimal 20 sites and return the probability that those sites would reach that goal. If that probability was too low, the trial manager would know they might need to re-negotiate some aspects of the trial specifications. For example, they might request a longer recruitment period or the ability to use more sites.
The second site selection problem variation was more complex because it also finds an appropriate number of sites for the user. Instead of fixing the number of sites, the user specifies a probability of achieving the goal and then the optimization approach determines how many sites are needed to achieve the goal with at least that user-specified probability. For example, a trial manager could specify that they want to be 90% confident that they will recruit 200 patients in 15 weeks. The tool would then determine how many and what sites should be selected such that the goal is forecasted to be met with at least probability 0.9. This tool provides a new capability to trial managers that is not available in the current off-the-shelf solution. The number of sites for a trial has been selected manually using heuristics; this tool allows more data-driven decision making regarding the number of sites in a trial.
Dashboard Development
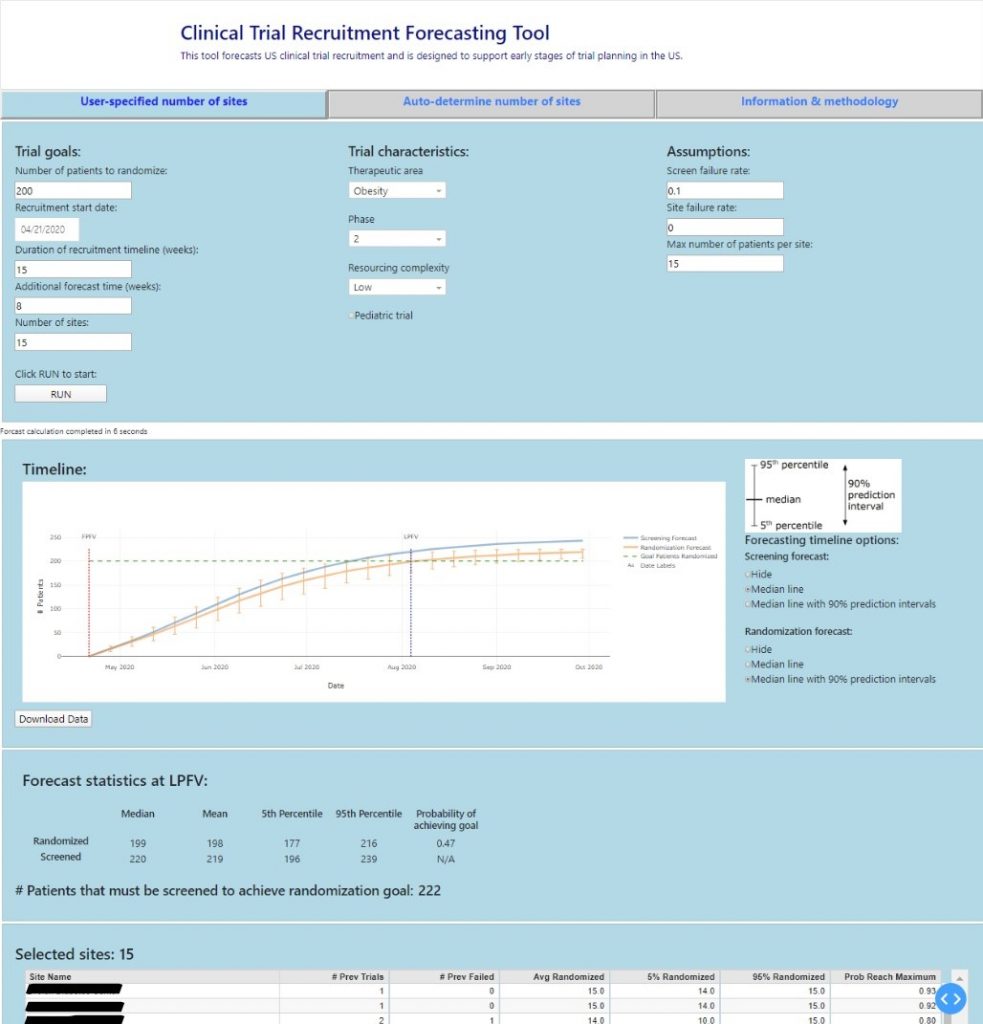
To integrate the new forecasts into decision-making processes and learn from user feedback, Mosaic shifted into developing a dashboard. The team worked with subject-matter experts to define a draft interface to be made into a prototype dashboard. This country-wide prototype will provide significant value to the company because only one person is currently licensed to use the off-the-shelf forecasting tool, creating an information bottleneck. An accessible dashboard was key to unlocking the value of the new models Mosaic developed and enabling data-driven decision making across the organization.
Initially, the goal was to visualize the forecasts in Tableau. However, after an initial exploration, it was determined that the forecast generation process was too complex for Tableau to support. Mosaic stepped up to develop an alternative solution using an open source dashboarding tool called Dash. Dash is a framework for building dashboard web applications in Python. Within two months the team had the prototype dashboard up and running. From there, the dashboard was iteratively refined based on user feedback.
Mentorship & Collaboration While Getting Forecasts to Decision Makers
In an effort to integrate the new forecasts into decision-making processes and learn from user feedback, a prototype dashboard is being developed. A draft interface provided by subject-matter experts on the team will be adjusted as needed based on analysis and modeling results. The dashboard itself will be produced by a dashboarding expert at the pharmaceutical company, with the enabling data and models provided by Mosaic and a growing internal data science team at the company. As the project has progressed, Mosaic has begun mentoring new data scientists on that team and working collaboratively with them on additional data set integration and model type explorations, as well as model deployment. This mentorship and collaboration will ensure that the new internal team is ready to take ownership of the data and modeling behind the prototype dashboard after it is deployed.