Summary
Mosaic developed custom ML forecasting models to help a leading CPG firm better plan Sales Force Routing.

Take Our Content to Go
Route Forecasting for a CPG Sales Force
Route forecasting is used widely within the transportation and logistics industry to optimize the routes of various vehicles. For example, route forecasting is used by airlines to move people more effectively and efficiently through the air, by trucking operators to save billions in operational costs, and by shippers to accurately predict shipment arrival times. Many companies beyond this industry face similar routing decisions, for instance, in setting sales targets and routes, but are these decisions being optimized? Data Science, specifically machine learning forecasting techniques, enables decision makers across a spectrum of industries to set more effective sales targets and plan profitable customer routes that boost top and bottom line growth.
The Promise of Machine Learning | Automation & Accuracy in Forecasting
One of the world’s most iconic beverage manufacturer and distributor sought help from the innovative machine learning consulting firm, Mosaic Data Science. The beverage company wanted to develop a forecasting solution to aid their regional managers in determining over 1,000 monthly route-level targets (sales volume), with each route made up of as many as 100 individual customers. Previously, the end-to-end process to develop route plan required over 800 person-hours each month and involved financial personnel, regional sales managers, and other staff input. Moreover, there was little consistency in how regional sales managers assigned route-level targets to meet overall regional targets. With a more consistent and robust forecast underlying the process, the performance of sales personnel could be more effectively evaluated and their highly performance-based compensation could be determined more equitably. As we set out to develop an automated forecasting solution, Mosaic took this basic goal as our own, with a bonus of potentially lessening the cost and burden inherent in the client’s current process.
Other factors specific to this CPG business practices guided our ML development process. For example, our solution had to be flexible enough to deal with changing route assignments and creation of new routes for which there was little training data. In addition, our client preferred interpretable models so that their analysts, account managers, and regional managers could understand how the predictions were generated. Getting buy-in from the beverage company’s regional managers, who had the final say in setting the route-level targets, would be critical to adoption of our model’s predictions.
Machine Learning Development | Custom Forecasting
To track our progress and baseline forecast performance, Mosaic Data Scientists created a Model Development Report using R Markdown. This was a key tool for communicating machine learning results to the client stakeholders. We began with naïve simple moving average models and iterated on increasingly complex models. Having worked previously with similar time-series data for other clients, we believed that a modeling library called “Prophet” would perform well. From our experience, we knew that this model would fulfill the customer’s flexible route assignment and interpretability requirements.
Prophet is similar to a GAM (Generalized Additive Model) and was developed by Facebook specifically for business time series forecasting. The basic model can be represented as:
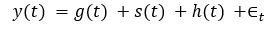
where g(t) is the trend function, s(t) is the periodic changes (seasonality), h(t) are the holiday effects and Ɛtare the errors. Additional regressors can also be added. This model has some distinct advantages, including:
- Flexibility: We can easily accommodate seasonality with multiple periods and let the analyst make different assumptions about the trend.
- Unlike with ARIMA models, the measurements do not need to be regularly spaced, and we do not need to interpolate missing values, e.g., from removing outliers.
- Fitting is very fast, allowing the analyst to interactively explore many model specifications. The forecasting model has easily interpretable parameters that can be changed by the analyst to impose assumptions on the forecast. Moreover, analysts typically have experience with regression and are easily able to extend the model to include new components.1
Machine Learning Interpretability | Translating Model Outputs
In this project, Mosaic benefited from our customer’s account managers who were very knowledgeable about how route-level targets should behave. Because account managers are typically compensated for sales targets, it makes sense that they would have lots of insight into their routes. Having interpretable parameters within our model allowed us to show an account manager the model’s assumptions and easily determine if these assumptions lined up with the account manager’s experience.
The Math behind the Sales Force Route Forecasting Model
As this project required us to generate 1,000-plus models (one for each route), we needed a model that could be fit extremely fast. Prophet model parameters are fit using Stan. Stan is a probabilistic programming language for specifying statistical models and provides full Bayesian inference for continuous-variable models through Markov Chain Monte Carlo methods. In Prophet, Stan performs the MAP (max a posteriori) optimization for parameters extremely quickly (<1 second), and gives us the option to estimate parameter uncertainty using the Hamiltonian Monte Carlo algorithm.2
For these reasons, and after generating some initial positive testing results, we chose Prophet as our main model and iterated on different versions. For example, one iteration included other explanatory variables such as promotional activity with the time series data, another removed the first month of new routes (assuming that the first month would not be representative), and others were tested with different parameter settings.
The accuracy of the models was evaluated using time series cross-validation. Cross-validation is a technique used to test how well a model will perform on unseen data. In brief, a random subset of data in the training dataset is held out, or not included in training the model. Then the model performance is evaluated on this held-out subset. Typically, iterations over multiple subsets are performed and evaluated. This method helps to reduce the common machine learning problem of overfitting. Time series cross-validation is similar to regular cross-validation; however, since time series data is ordered, we must make a modification to regular cross-validation. Time series cross-validation can be considered as a one or multi-step ahead evaluation on a rolling forecasting origin.
As mentioned previously, Mosaic Data Science iterated on potential models starting with the simplest moving average models. The following chart summarizes our modeling development progress.
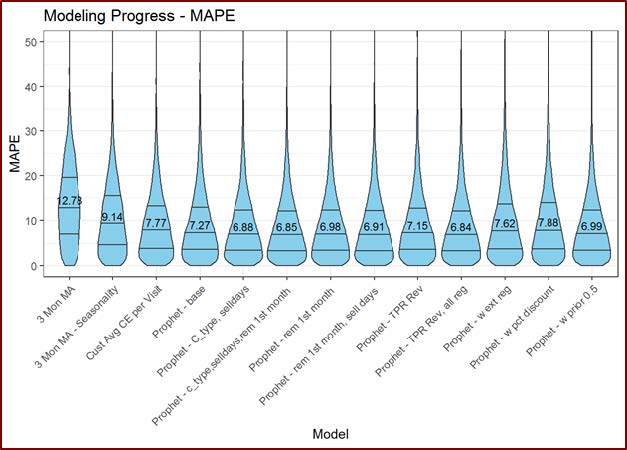
In this violin chart, the ‘violins’ (similar to boxplots, except that a distribution is shown) represent the averaged cross-validated errors for each route. Each ‘violin’ represents a separate model version. If the results were similar, we favored the more parsimonious model.
Once our final model was chosen, we planned to deploy the model in production, automating the forecasting for use by regional managers and other key decision makers.
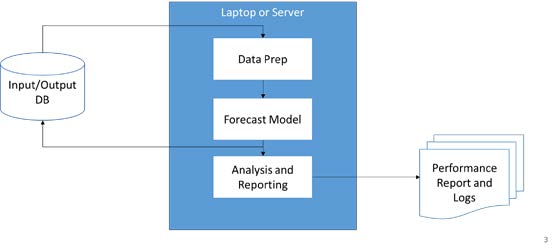
Deploying the Sales Force Route Forecasting into Production
Due the relatively simple production architecture, creating a script to train the model, generate predictions, and store results was straightforward. The scripts are run automatically using RStudio Connect but can also be run on a laptop if desired. One notable option that we included was the ability to override the route assignments from what was in the database to an alternate table or csv file containing route assignments. In this way, our client could test the effects of changing route assignments on the predictions.
For each run of the model, we included in the output a Production Model Report, an automatically generated report of model health. This built-in utility performs sanity checks on the data, logs errors, generates time-series cross validation error metrics, and outputs summary statistics and charts. This integrated QA check and bill of health is vital to ensuring that the models are running smoothly and that accuracies are not deteriorating over time.
Results/Conclusion
Due to our experience in time-series modeling, Mosaic was able to satisfy our customer’s requirements by developing and deploying models that accurately predict route-level targets. Our flexible solution allows our client’s analysts to assess the assumptions of the models due to their interpretability. This produces confidence in the predictions so that the forecasted targets are actually used by the account managers in planning their sales routes. Through our automated route forecasting model, Mosaic successfully reduced person-hours in determining monthly sales targets, freeing up time and resources for other important initiatives.
For More Information
Want to learn more? Please contact info@mosaicdatascience.com