AI Blog Series | Biometric Customer Segmentation
Post #2 in our blog series examining how leading athletic clothing retailers can develop and deliver products using custom AI models.
Why segmentation matters?
With the rise of machine learning and Artificial Intelligence (AI), clothing retailers & manufacturers have a tremendous opportunity to create more meaningful relationships with their customers. Through an effective segmentation strategy, firms can reach a consumer with specific products based on their needs. In fact, the majority of consumers now demand a tailored shopping experience, and if you aren’t providing it, your competitors surely are.
Instead of looking at your customers as demographic or location-based groups, establishing a behavior-based segmentation strategy will give you an insight into how they are actually using your products. By fusing non-traditional data sources into clustering algorithms, businesses executives can design those highly personalized shopping experiences backed by AI.
Bridging the Biometrics Analytics Gap
In blog post #1, we examined the importance and techniques for bridging the gap between incorporating biomarker data for professional athletes and the general public. In short, wouldn’t it be great to market to the masses that they are using athletic gear tailored specifically for them?
Top tier athletes have reaped the rewards from these insights, but through effective biometric customer segmentation and clustering, businesses can offer these same products to a more general consumer population.
Taking Machine Learning to the Next Level | Intelligent Biometric Customer Segmentation
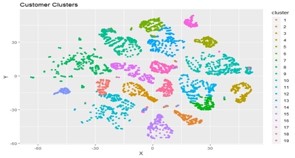
One way to create an effective biometric customer segmentation analysis is to use a clustering algorithm with customer, product and bio characteristics as inputs. Clustering is a common unsupervised learning technique that finds patterns in data, grouping similar observations together. There are many different clustering algorithms, but all translate similarity on a set of features into a single ‘distance’ metric between observations. Starting with a matrix of distances between all pairs of observations, the algorithm will partition the data into groups such that observations within a group are more similar to each other and observations in different groups are less similar to each other.
Let’s use a biometric customer segmentation example to make this more concrete. Imagine a sporting goods manufacturer and distributor is interested in a targeted marketing campaign. Although the sporting goods company knows not to advertise baseball bats to a hockey player, the goods firm may not be able to specify a precise set of customer features that correlate with a baseball bat purchases beyond a vague idea of ‘having purchased baseball cleats.’ It is also possible that the same customer is likely to buy multiple types of baseball bats for optimal performance.
Perhaps this company has a large set of transaction records where each transaction contains information about the product purchased, such as type, make, model, color and price. Imagine the sales rep at the store entered customer information into a CRM system that integrates with the purchase data. Finally, imagine a large biomarker database the company has access to, which can integrate with both databases.
Using these integrated data sources, one might use a k-means or k-medoids algorithm to cluster both customers, their purchased products and biological information together. This will yield a set of clusters of customers that are similar on characteristics that relate to their shared preference for a specific type of product. For example, there may be a cluster of high-performance baseball bat transactions purchased by middle-aged married men, and another cluster of young, single men and women that purchased smaller bats made for young children. By using the transaction and biomarker records to create segments, the customers will not be segmented based on random shared characteristics, but rather, on the shared characteristics that also correlate with a similar type of purchase.
Transforming Machine Learning Outputs into Actionable Insights
Now, at the end of the day, the sporting goods company wants a set of customer segments, not transaction/bio segments, so how do we get from transaction-bio-based clusters to customer segments without purchase information?
One strategy is to subset the customer features out of the larger transaction/bio dataset used in the first round of clustering, and combine those transaction clusters that contain very similar customers. In other words, we might want to combine all of the “young family” transaction segments into one customer group, even if they originally started in two separate transaction/bio clusters because some purchased smaller sized bats and others purchased baseball gloves. For future marketing efforts, all of these customers would receive similar messaging based on one or both of these product types.
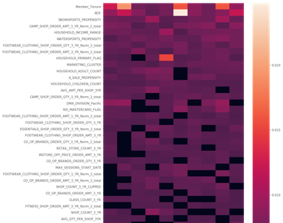
A quantitative way to determine which transaction/bio clusters to combine is to calculate a new distance matrix on just the customer features between the centroids (k-means) or medoids (k-medoids) calculated by the transaction/bio clustering process (a centroid is a computed cluster center, whereas a medoid is an actual observation closest to the center of the cluster). These centroids or medoids are the centers of the cluster definitions by the clustering algorithm; all other observations are in a particular cluster because they are closer to the selected cluster’s center than to any of the other clusters’ centers.
If two centroids/medoids were different when using the product features to calculate distance, but are actually very similar when compared on just customer attributes, then the distance between the pair using just the subset of customer attributes would be very small. When evaluating the customer segmentation analysis, one can then set a distance threshold to use in determining which clusters should be combined. After making these combination decisions, any customers in the transaction dataset that were originally assigned to a cluster that no longer exists would be reassigned to the new, combined cluster. Finally, one can generate and evaluate descriptive statistics on the set of customers in each segment to come up with qualitative descriptions of each customer segment for future use.
While this process may ultimately yield customer segments just like any other customer segmentation analysis method that exclusively uses customer characteristics, the iterative approach has benefits. Because the customer segments are constrained to at most the number of combined customer-product transaction clusters, there will only be as many customer segments as there are distinct types of buyers. Buyers that look different on paper but don’t prefer different products will not receive different marketing material, while customers that look similar but have different preferences will receive different marketing. As a result, the approach generates intelligent segmentation—customers are differentiated only to the extent necessary for effective preference-based marketing. And a side benefit is that product clusters can similarly be combined to generate more meaningful product segments in terms of customer choice.
How can a professional sports team apply machine learning driven segmentation?
A professional team might not be in the same business as a clothing or goods manufacturer, but the goal of offering products and services that consumers actually want is universal. The machine learning models remain the same, but the data inputs and outputs might be a bit different. A professional sports franchise has many data points on which to draw from including; transaction history, loyalty/mobile program, facial recognition (from stadium cameras), and as in the example above, third party enrichment sources.
Wouldn’t it be nice to fuel bottom-line growth with more ticket sales, merchandise profit and corporate sponsorships? Manually digging through spreadsheets and turning the crank for targeted marketing campaigns, and if you aren’t embracing the automation features of predictive analytics, your COGS will suffer. Machine learning and AI offer decision makers the ability to treat large groups of customers with a more personal touch, driving sales growth and boosting fan loyalty.
Biometric Customer Segmentation Conclusion
According to Salesforce, 67% of customers don’t mind paying a premium if businesses can provide them with a personalized experience. Segmentation and clustering offer a great way for sporting goods retailers and manufactures to utilize ML & AI for creating better consumer connections and driving bottom line growth.
Above all, segmentation helps you start innovative, and AI is not performed in a vacuum. These models are built on good, solid analytics, and should be updated regularly with more and more data. Unsupervised machine learning and proper data pipelining will facilitate better marketing decision making well into the future.