Summary
We built a custom AI-driven tool for one of the largest Oil & Gas firms in the world to identify fuel usage anomalies across their entire fleet.

Take Our Content to Go
Background
Our client, one of the largest Oil & Gas companies in the world, owns and leases diesel supply ships to deliver diesel fuel to offshore drilling rigs and production platforms and to provide additional support services as needed. These ships burn diesel fuel from the same supply used to replenish fuel on the platforms. Once a ship returned to port, it was historically difficult to account for how much fuel was delivered to platforms, how much was used to fuel the ship’s operations, and how much may have been lost to other unapproved activities.
To track fuel usage, our client relied on manually reported fuel burn and delivery logs kept by ship captains. However, business analysts and operational managers wanted a way to accurately model daily fuel usage without depending on the accuracy and honesty of these logs. Previous attempts to develop such a tool internally resulted in highly inaccurate model predictions.
Mosaic Data Science, an innovative AI consulting firm with proven experience in the energy industry, was brought on to develop an improved fuel usage prediction tool. The data-driven predictions would enable business analysts and auditors to closely track daily fuel consumption for the customer’s fleet of ships and to isolate potential cases of fraud where predicted fuel burn did not match the fuel consumption reported in the ship’s logs. Predicting fuel usage anomalies would drive immediate bottom line growth.
Predicting Fuel Usage Anomalies | Data Mining
At the start of the engagement, Mosaic’s data scientists met with customer stakeholders to understand diesel resupply operations, what data is collected and how it is collected and stored, and the objectives of the business analysts and other potential users of the tool. Mosaic determined that a light-weight, machine learning-based tool built in R (a statistical programming language) would be the most cost-effective approach to deploy an effective predictive capability. Mosaic would help to integrate the predictions with an existing front-end analysis tool to minimize customer costs and the need for user training.
Daily historical data was available for up to 2 years for each ship in the fleet and encompassed various activities, logged down to the minute, but only total fuel use per day. This aggregate daily fuel use observation was one of the key challenges to developing an accurate model. To be effective, the model would need to allocate fuel usage to individual activities to establish fuel burn rates that could be generalized to any mix of activities in the future.
Predicting Fuel Usage Anomalies | Model Selection
Mosaic’s data science consultants solved this problem with an aggregate observation regression machine learning model. Assuming that burn rates are more or less constant for each activity for a given ship ( gallons per minute for activity ), if the activity log indicates that the ship performed each activity for minutes during the day, then the total fuel burn for the day is approximated by:

With this problem definition, the approximate values for can be solved for using a simple linear regression. For up to 2 years of history, each ship’s daily reported activities and fuel burn were extracted from the ship’s logs. To account for differences between ships, a separate regression model was trained for each ship to generate ship-specific fuel burn rates that could be used to predict fuel burn for that ship based on future activity reports.
For ships with only a few months of historical data, there were often too few reports of some of the 44 possible activities to accurately compute the activity-level fuel burn rate. However, many activities are similar in terms of fuel consumption. Working with the client, Mosaic’s data science consultants built a hierarchy of activities to allow activities to be dynamically aggregated into higher-level groups as needed based on each vessel’s history. For vessels with abundant data, activities were lightly grouped, whereas activities were heavily grouped for vessels with less data available.
An additional challenge we faced in developing the model was accounting for changes in ship performance over time. For example, engine maintenance or equipment upgrades can increase or decrease fuel efficiency for different activities. Taking this factor into consideration, Mosaic implemented a weighting scheme to give higher precedence to recent data points when training the machine learning models. As a result, fuel burn rates for frequently reported activities would be based primarily on recent data while burn rates for more rarely reported activities would be based on data over a longer time span.
Model Deployment
Mosaic deployed an automated model training and deployment framework developed in R into the customer’s IT environment. In addition, we implemented validation reports that are automatically distributed to the client’s analytics team each time the model is retrained on new data. These reports include important metrics and figures that are key to understand the output of the model and performance for each vessel in the fleet.
Results
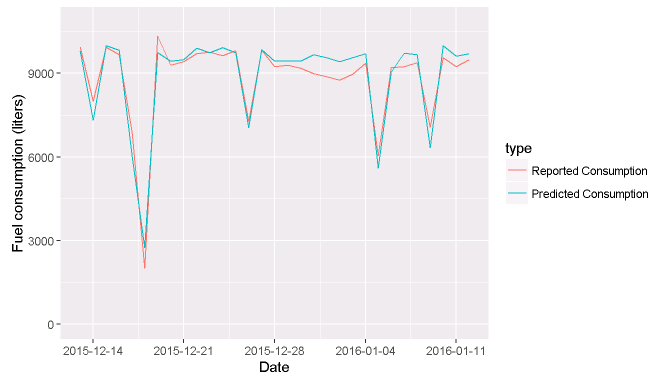
The daily fuel usage prediction model developed by Mosaic Data Science heavily reduced forecasting errors. While the previous tool’s error rate was often over 40%, our model decreased errors to 10% on average over the entire diesel resupply fleet and to 5% on average for vessels with a year or more of operational history. Figure 1 shows the close daily tracking between the predicted and reported fuel consumption for one ship.

The solution Mosaic delivered allows our client to more quickly and reliably spot fuel usage anomalies, which has been credited with substantially reducing fuel loss across the fleet.


