Summary
Oil & gas firms have a tremendous opportunity to refresh demand forecasts with ML techniques, improving accuracy and adding to the bottom line.

Take Our Content to Go
Mitigating Demand Forecasting Inaccuracy
Our client, one of the largest Oil & Gas companies in the world, wanted to solve the problem of excess and insufficient product at their diesel and gasoline distribution terminals. Every day, tanker trucks pull up to pipeline terminals to fill up on diesel and gasoline for distribution to retail locations across North America. If there is too little available product in the storage tanks when a customer arrives then they are unable to fulfill that customer’s demand. If there is too much product in the tanks when a new pipeline delivery is scheduled to arrive then they must sell the gasoline or diesel at a deep discount to create tank space for the incoming delivery. Either way, they lose money. Identifying and predicting these terminal inventory imbalances is challenging due to the uncertainty in terminal demand and the exact time when scheduled deliveries will arrive to the terminal, among other variables. Historically, the client’s schedulers relied on their expertise to identify and mitigate possible imbalances.
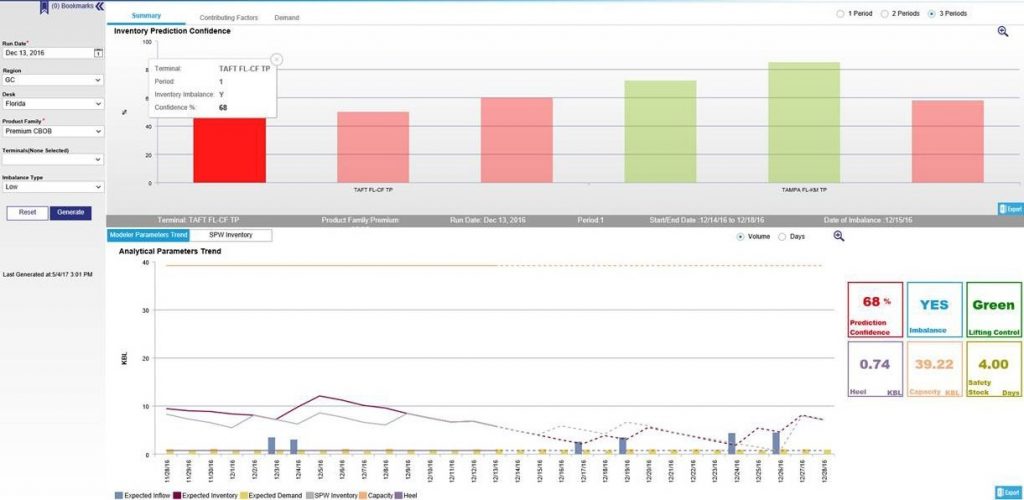
Mosaic was brought in to help develop, maintain, and refresh a machine learning model which forecasts demand and factors in this predicted demand, scheduled deliveries, and information about terminal dynamics and uncertainty to more accurately predict terminal imbalances. The predictive model, which alerts schedulers when there is a high risk of a near-term inventory imbalance at a terminal, allows the client’s schedulers to get a real-time and forward-looking picture of what is happening with their assets, improves productivity, and facilitates quicker and better decision making that avoids costly inventory imbalances before they occur. Mosaic’s predictions are critical to the company’s terminal operations.
Machine Learning Approach for Demand Forecasting
Mosaic, a premier AI consulting firm, successfully completed and deployed the terminal imbalance prediction model. Efficient use of the available data and models designed to specifically conform to user needs for performance and transparency were key for the success of the predictive tool. The SPSS-based models predict the risk of an inventory imbalance for each product at each of the client’s 91 domestic terminal locations. Real-time data pulls come from a SAP HANA high-performance in-memory database. Product schedulers use the models’ predictions in their decision-making process when managing inventories and pricing across the distribution network.
Mosaic was able to improve model performance by defining new inputs to the predictive model and redesigning terminal clustering to better account for differences in data quality and demand trends across the distribution network. Mosaic also supported/interpreted the model performance reports and added additional reports to facilitate performance tracking.
The predictive solution combines a time series model and classification trees to predict the risk of a high or low inventory imbalance happening up to 15 days in the future. Daily predictions are generated with real-time data and presented to the schedulers. The time series model is able to discover demand trends over time for each diesel and gasoline product at each terminal location and accounts for the dependence of demand on pricing and other variables. The time series model is used to accurately forecast future demand. The predicted demand is used as an input to the classification trees.
Machine Learning for Demand Forecasting Improvements
The prediction model is able to correctly alert on over 90% of potential imbalances. It improves scheduler productivity by combining different sources of information and providing reliable imbalance predictions generated using years of historic data. Mosaic played a key role in improving the prediction model performance by implementing a new way of aggregating terminals, leading to a performance increase of up to 10% for some terminals.
The operational decision makers who ingest the results of this predictive model are able to make better decisions that help reduce:
- Customer service late deliveries
- Customer diversions to other terminals
- Lost orders in which customers go to a competitor
- Transportation waiting times
- Dead freight
- High inventories to increase working capital