Summary
Our ML consultants helped a publicly traded, multi-national manufacturer more accurately identify and predict drivers of revenue.

Take Our Content to Go
Revamping Forecasts with ML
A large multinational corporation that designs and manufactures dispensing equipment for consumer and industrial adhesives, sealants and coatings contracted Mosaic as a data science consultant. This organization needed to improve their forecasting processes and outputs to optimize inventory and supply to customers, to better understand the market trends that influenced their customers’ behavior, and to provide shareholders a more accurate representation of the business. Implementing these forecasts will keep the firm’s cost of goods sold down, elevating profit margins and having a positive downstream effect on other sales metrics.
The manufacturer wanted to segment their forecasts by the different markets that they serve, e.g., aerospace, consumer electronics, and life sciences. The company had been collecting transactional data by line of business, region and industry. Now that the company had collected all of this data, they needed to perform predictive analysis on it to extract value. With no internal data scientists available for this work, Mosaic was tapped.
Mosaic, a premier data science consulting firm, was asked to initially focus on a number of North American business segments. The primary data mining task was to uncover hidden relationships in the data, provide these insights back to the manufacturer’s management team, and build more robust and accurate revenue forecast models for each business segment.
Advanced Revenue Forecasting | ML Techniques
The main goals of the analysis were to identify variables that had a significant impact on the monthly revenue and use them to predict future revenue. The provided revenue data and external index data were not uniform in their form. For example, some indices were produced monthly while others were quarterly, and many were embedded in formatted spreadsheets. The data were first cleaned and processed to transform the data into a useable format. Mosaic wrote scripts to perform the data wrangling tasks that could be quickly modified to add new indices or analyze different industry segments in the future.
Once the data was clean and ready for processing, Mosaic performed a pure time series analysis, a time series regression analysis, and an ARIMAX analysis. ARIMAX extends the more commonly used ARIMA (Autoregressive Integrated Moving Average) time series model to allow data scientists to incorporate predictor variables (market indices) alongside traditional time series effects. By comparing these various models, Mosaic was able to quantify the potential increase in prediction accuracy from adding the predictor variables. Separate model sets were built for each industry segment.
The analysis identified the relevant predictor variables using stepwise variable selection. By iteratively adding or dropping predictor variables that provided the greatest improvement to the model’s Akaike Information Criterion (AIC – a measure used to balance forecast accuracy against model complexity), a locally optimal set of variables is eventually reached that includes only highly correlated predictors. With careful cross-validation, Mosaic could accurately estimate the true error of the forecasts generated from the selected set of variables. Once the final variables were selected, the final model could be used by the customer to produce more accurate and robust forecasts.
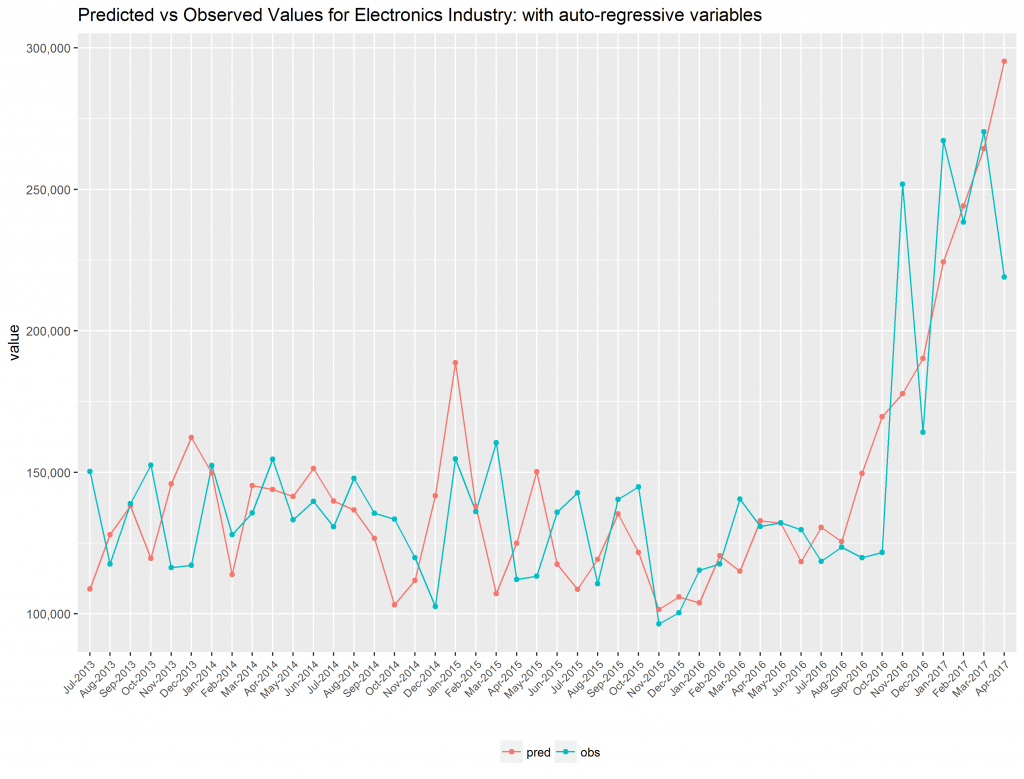
The chart below shows the predicted versus observed values for one industry segment.
Advanced Revenue Forecasting | Results
Mosaic was able apply predictive analysis tools to identify key predictors of aggregate customer behavior and to more accurately forecast the manufacturer’s monthly line-of-business revenues, providing shareholders a more robust view of the business and providing the business with analytics insights they can act upon. The manufacturer was able to see quantifiable results from applying data science to their data.