In the ultra competitive world of management consulting, any downtime is lost revenue and can be leading to a less-than-satisfied customer. Management consultants need access to the latest and greatest in technology to provide superior customer service and to keep pace with their competition. A great opportunity to increase technology performance comes from root cause analytics of computer telemetry failures.
When executives at a large management consulting firm noticed that their Microsoft Office applications sometimes took upwards of 10 seconds to load, the firm’s IT department knew it had a problem.
IT professionals suspected that one or more custom add-ins (e.g., macros with brand-consistent templates) might be to blame. Mosaic Data Science, a leading data science consulting firm, was brought in to investigate two questions: were particular versions of add-ins leading to longer-than-normal load times; and were particular computers experiencing long load times more often than others?
Mosaic proposed a diagnostic & root cause analytics approach to answering the hypotheses. Our data science consultants accessed the firm’s telemetry database, an enterprise solution that collects information from each employee’s computer each time an Office application is opened. When an application is opened, the database records which add-ins were also loaded, their versions, and their load times.
First, Mosaic just looked at the most recent load time on each computer of several custom add-ins for which new (and hopefully improved) versions had recently been deployed. The results were disappointing, particularly for one key Excel add-in: although most load times using the new versions were faster than most load times under the old versions, there were still surprisingly large numbers of computers experiencing load times of 2+ seconds with the new add-in versions.
Mosaic decided to dig deeper, though, before drawing strong conclusions about the effectiveness of the new Excel add-in. After all, only looking at a single load time for each computer may give an inaccurate picture of average load times for each machine, as these recent records could be atypical for unrelated reasons (e.g., if a user was opening a very large file).
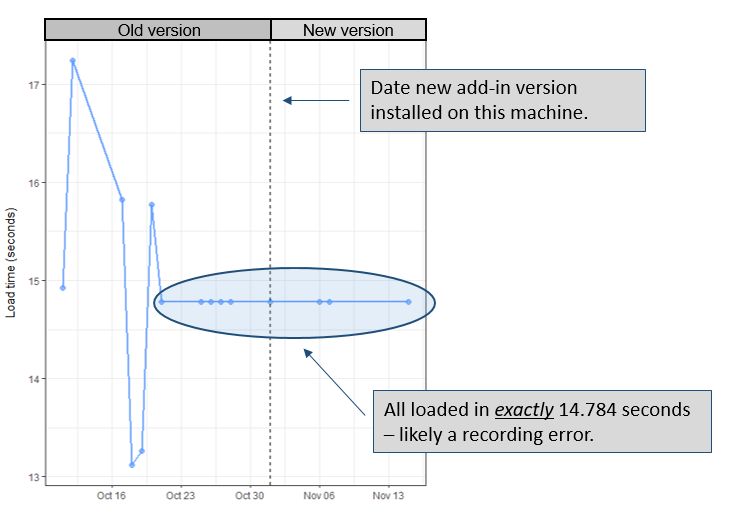
Upon further investigation using multiple records per computer, Mosaic discovered that there were unusually high correlations between sequential load times, with some load times being recorded as identical (to the millisecond) on 6 or 7 consecutive loads for a machine. It seemed that the telemetry database was inaccurately capturing load times – recording the correct dates and versions of add-ins that were loaded, but sometimes recycling the values for how long it took the add-in to load from a previous record. This meant that even if the new version was quicker to load, looking at records shortly after a machine upgraded (and for which old, long load times might be incorrectly inserted into new-version records) may mask the true benefit of the new edition.
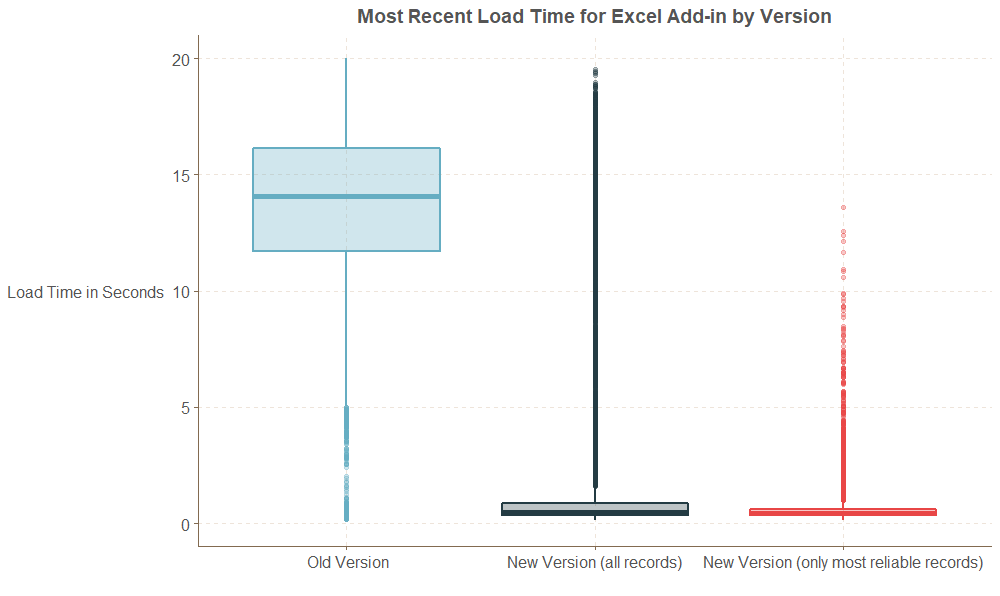
With this information, Mosaic was able to come up with a workaround to determine and evaluate loads for the only the most reliable of the new-version-records. When looking at this subset of new-version load times only, the benefit of the new add-in version was clear: the old add-in version took more than 5 seconds to load for 98% of users; the new add-in version took more than 5 seconds for just 1% of users, and in fact loaded in less than 2 seconds for 95% of users.
Armed with Mosaic’s machine learning consulting results and some simple data visualizations, the IT department was able to present a clear picture and recommendation to the firm’s executive team: the new add-in version was much faster than the old version, and all employees should be encouraged to install software updates immediately if programs were routinely slow to open.


0 Comments